

You can find the name of your lab instructor in myZou or Canvas. 1) Place two...
Fantastic news! We've Found the answer you've been seeking!
Question:
Transcribed Image Text:
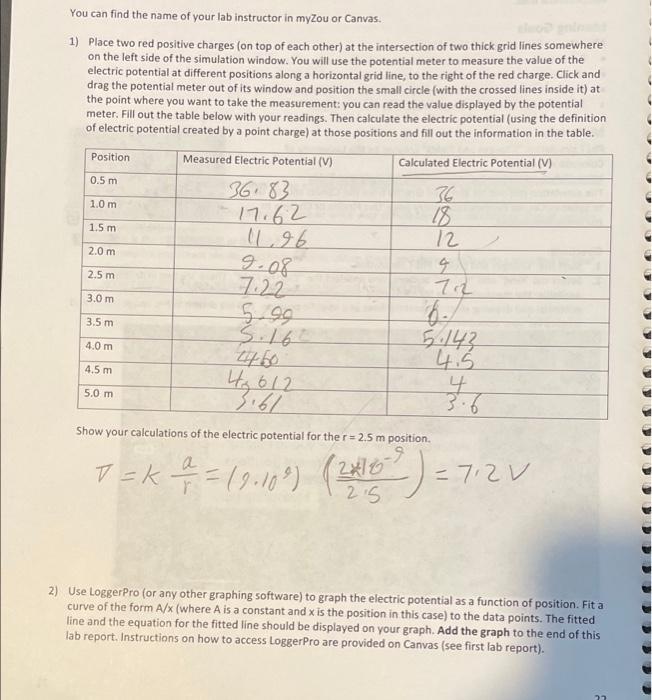
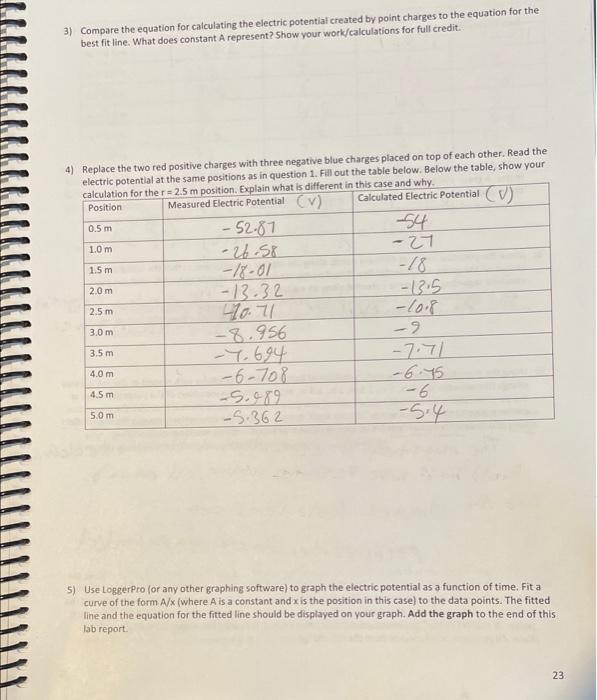
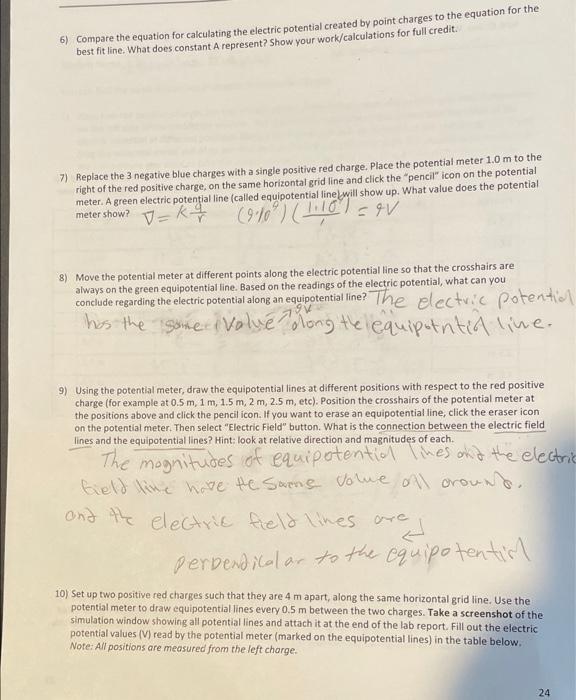
You can find the name of your lab instructor in myZou or Canvas. 1) Place two red positive charges (on top of each other) at the intersection of two thick grid lines somewhere on the left side of the simulation window. You will use the potential meter to measure the value of the electric potential at different positions along a horizontal grid line, to the right of the red charge. Click and drag the potential meter out of its window and position the small circle (with the crossed lines inside it) at the point where you want to take the measurement: you can read the value displayed by the potential meter. Fill out the table below with your readings. Then calculate the electric potential (using the definition of electric potential created by a point charge) at those positions and fill out the information in the table. Measured Electric Potential (V) Calculated Electric Potential (V) 36.83 17.62 11,26 Position 0.5 m 1.0 m 1.5 m 2.0 m 2.5 m 3.0 m 3.5 m 4.0 m 4.5 m 5.0 m 9.08 7.22 5.99 S.16 4₂612 3.61 36 18 12 4 722 5.143 4.5 4 3.6 Show your calculations of the electric potential for the r= 2.5 m position. 7 = K = = (9-18") (2016-²2 ) = 72V 17.10% 2) Use LoggerPro (or any other graphing software) to graph the electric potential as a function of position. Fit a curve of the form A/x (where A is a constant and x is the position in this case) to the data points. The fitted line and the equation for the fitted line should be displayed on your graph. Add the graph to the end of this lab report. Instructions on how to access LoggerPro are provided on Canvas (see first lab report). 3) Compare the equation for calculating the electric potential created by point charges to the equation for the best fit line. What does constant A represent? Show your work/calculations for full credit. 4) Replace the two red positive charges with three negative blue charges placed on top of each other. Read the electric potential at the same positions as in question 1. Fill out the table below. Below the table, show your calculation for the r= 2.5 m position. Explain what is different in this case and why. Position Measured Electric Potential (V) Calculated Electric Potential (V) 0.5 m 1.0 m 1.5 m 2.0 m 2.5 m 3.0 m 3.5 m 4.0 m 4.5 m 5.0 m -52-87 -26-58 -18-01 -13.32 40.71 -8.956 -7.694 -6-708 -5.989 -5.362 -54 -27 -18 -13.5 -10.8 -9 -7.71 -6.75 -6 -5.4 5) Use LoggerPro (or any other graphing software) to graph the electric potential as a function of time. Fit a curve of the form A/x (where A is a constant and x is the position in this case) to the data points. The fitted line and the equation for the fitted line should be displayed on your graph. Add the graph to the end of this lab report. 23 6) Compare the equation for calculating the electric potential created by point charges to the equation for the best fit line. What does constant A represent? Show your work/calculations for full credit. 7) Replace the 3 negative blue charges with a single positive red charge. Place the potential meter 1.0 m to the right of the red positive charge, on the same horizontal grid line and click the "pencil" icon on the potential meter. A green electric potential line (called equipotential line will show up. What value does the potential V=k+ meter show? (9-10°) (110) =9V 8) Move the potential meter at different points along the electric potential line so that the crosshairs are always on the green equipotential line. Based on the readings of the electric potential, what can you conclude regarding the electric potential along an equipotential line? The electric potential has the same Value Tolong the equipoentid live. 9) Using the potential meter, draw the equipotential lines at different positions with respect to the red positive charge (for example at 0.5 m, 1 m, 1.5 m, 2 m, 2.5 m, etc). Position the crosshairs of the potential meter at the positions above and click the pencil icon. If you want to erase an equipotential line, click the eraser icon on the potential meter. Then select "Electric Field" button. What is the connection between the electric field lines and the equipotential lines? Hint: look at relative direction and magnitudes of each. The magnitudes of equipotential lines and the electric bield line have the same volue all around. and the electric field lines are perpendical ar to the equipotential 10) Set up two positive red charges such that they are 4 m apart, along the same horizontal grid line. Use the potential meter to draw equipotential lines every 0.5 m between the two charges. Take a screenshot of the simulation window showing all potential lines and attach it at the end of the lab report. Fill out the electric potential values (V) read by the potential meter (marked on the equipotential lines) in the table below. Note: All positions are measured from the left charge. 24 You can find the name of your lab instructor in myZou or Canvas. 1) Place two red positive charges (on top of each other) at the intersection of two thick grid lines somewhere on the left side of the simulation window. You will use the potential meter to measure the value of the electric potential at different positions along a horizontal grid line, to the right of the red charge. Click and drag the potential meter out of its window and position the small circle (with the crossed lines inside it) at the point where you want to take the measurement: you can read the value displayed by the potential meter. Fill out the table below with your readings. Then calculate the electric potential (using the definition of electric potential created by a point charge) at those positions and fill out the information in the table. Measured Electric Potential (V) Calculated Electric Potential (V) 36.83 17.62 11,26 Position 0.5 m 1.0 m 1.5 m 2.0 m 2.5 m 3.0 m 3.5 m 4.0 m 4.5 m 5.0 m 9.08 7.22 5.99 S.16 4₂612 3.61 36 18 12 4 722 5.143 4.5 4 3.6 Show your calculations of the electric potential for the r= 2.5 m position. 7 = K = = (9-18") (2016-²2 ) = 72V 17.10% 2) Use LoggerPro (or any other graphing software) to graph the electric potential as a function of position. Fit a curve of the form A/x (where A is a constant and x is the position in this case) to the data points. The fitted line and the equation for the fitted line should be displayed on your graph. Add the graph to the end of this lab report. Instructions on how to access LoggerPro are provided on Canvas (see first lab report). 3) Compare the equation for calculating the electric potential created by point charges to the equation for the best fit line. What does constant A represent? Show your work/calculations for full credit. 4) Replace the two red positive charges with three negative blue charges placed on top of each other. Read the electric potential at the same positions as in question 1. Fill out the table below. Below the table, show your calculation for the r= 2.5 m position. Explain what is different in this case and why. Position Measured Electric Potential (V) Calculated Electric Potential (V) 0.5 m 1.0 m 1.5 m 2.0 m 2.5 m 3.0 m 3.5 m 4.0 m 4.5 m 5.0 m -52-87 -26-58 -18-01 -13.32 40.71 -8.956 -7.694 -6-708 -5.989 -5.362 -54 -27 -18 -13.5 -10.8 -9 -7.71 -6.75 -6 -5.4 5) Use LoggerPro (or any other graphing software) to graph the electric potential as a function of time. Fit a curve of the form A/x (where A is a constant and x is the position in this case) to the data points. The fitted line and the equation for the fitted line should be displayed on your graph. Add the graph to the end of this lab report. 23 6) Compare the equation for calculating the electric potential created by point charges to the equation for the best fit line. What does constant A represent? Show your work/calculations for full credit. 7) Replace the 3 negative blue charges with a single positive red charge. Place the potential meter 1.0 m to the right of the red positive charge, on the same horizontal grid line and click the "pencil" icon on the potential meter. A green electric potential line (called equipotential line will show up. What value does the potential V=k+ meter show? (9-10°) (110) =9V 8) Move the potential meter at different points along the electric potential line so that the crosshairs are always on the green equipotential line. Based on the readings of the electric potential, what can you conclude regarding the electric potential along an equipotential line? The electric potential has the same Value Tolong the equipoentid live. 9) Using the potential meter, draw the equipotential lines at different positions with respect to the red positive charge (for example at 0.5 m, 1 m, 1.5 m, 2 m, 2.5 m, etc). Position the crosshairs of the potential meter at the positions above and click the pencil icon. If you want to erase an equipotential line, click the eraser icon on the potential meter. Then select "Electric Field" button. What is the connection between the electric field lines and the equipotential lines? Hint: look at relative direction and magnitudes of each. The magnitudes of equipotential lines and the electric bield line have the same volue all around. and the electric field lines are perpendical ar to the equipotential 10) Set up two positive red charges such that they are 4 m apart, along the same horizontal grid line. Use the potential meter to draw equipotential lines every 0.5 m between the two charges. Take a screenshot of the simulation window showing all potential lines and attach it at the end of the lab report. Fill out the electric potential values (V) read by the potential meter (marked on the equipotential lines) in the table below. Note: All positions are measured from the left charge. 24
Expert Answer:

Related Book For 

Financial and Managerial Accounting
ISBN: 978-1133940593
10th edition
Authors: Belverd E. Needles, Marian Powers, Susan V. Crosson
Posted Date:
Students also viewed these law questions
-
Please help me with this its urgent please help me for freee How will the social sciences affect your life in the following areas and explain why: Area of Life Effect and why Work / Career Home and...
-
Economics Hi please help me this statement thanks Hi please help me to answer this statement on below question, you dont have to show your work (in this case the decision tre
-
Please help with the following questions below... 1) Based on your SWOT of Southwest Airlines, explain which one of the 5 generic business strategies you think Southwest is following and why. Explain...
-
Write using only positive exponents and then evaluate. Assume that all variables represent nonzero real numbers. 5 -2
-
1. In which ways do smartphones help these companies be more profitable? To what extent are improvements in performance coming from revenue increases or cost reductions? Provide several examples from...
-
Calculate the value of the z test for each of the following situations: a. hyp = 100; = 16; n = 25; X = 94 b. hyp = 100; = 15; n = 9; X = 108 c. hyp = 150; = 20; n = 81; X = 130 d. hyp = 150; ...
-
What the differences are between arbitration and mediation?
-
Georgia Orchards produced a good crop of peaches this year. After preparing the following income statement, the company is concerned about the net loss on its No. 3 peaches. In preparing this...
-
Assignment two (ch.13) (15%) - with 4 marks bonus > Question one - The equity sections for Atticus Group at the beginning of the year (January 1) and end of the year (December 31) follow. - 13 marks...
-
Grove Audio is considering the introduction of a new model of wireless speakers with the following price and cost characteristics. Required a. What number must Grove Audio sell annually to break...
-
Yield to Call Find the yield to call for a 9% coupon, $1,000 par 15 year bond selling at $1020.50 if the bond is callable in 5 years at a call price of $1,090. The bond makes semiannual coupon...
-
Different wireless technologies exist, some operate in low frequency bands and some operate in high frequency bands. Explain the advantages and disadvantages of a high frequency technology (10s of...
-
There are four points A (2, 6), B(6, 4), C(4, 0) and D(0, 2) on the coordinate plane. Identify the pairs of parallel and perpendicular lines
-
Summer Day Inc. manufactures two models of its hammock, the Superior and the Deluxe. The Superior model requires 15, 0 0 0 direct labour hours and the Deluxe requires 45, 0 0 0 direct labour hours....
-
Solve the compound inequality for x. 2x 24 or 3x-1>8
-
The following table provides a probability distribution for the random variable x. x369 f(x) .25 .50 .25 a. Compute E(x), the expected value of x. b. Compute 2, the variance of x (to 1 decimal). c....
-
Solve this java programming assignment Coding Assignment: In this problem you will develop code to simulate a dual-class queuing system with traffic loopback. The server you simualate accepts...
-
(8%) Problem 6: A student attaches a f= 3.5 kHz oscillator to one end of a metal rail of length L = 25 m. The student turns on the oscillator and uses a piezoelectric gauge at the other end to...
-
Common types of current liabilities, contingencies, and commitments follow. a. Accounts payable b. Bank loans and commercial paper c. Notes payable d. Dividends payable e. Sales and excise taxes...
-
In the CVS annual report in the Supplement to Chapter 1, refer to the balance sheet and the Summary of Significant Accounting Policies in the notes to the financial statements. 1. Examine the...
-
Indicate whether each of the following actions is primarily related to (a) Managing cash needs, (b) Setting credit policies, (c) Financing receivables, or (d) Ethically reporting accounts receivable:...
-
The following table is a life table, reproduced from the chapter introduction. With an understanding of some basic concepts of probability, one can use the life table to compute the probability that...
-
In Example 5.4, what is the probability that the oldest child and the youngest child are of the same gender? Example 5.4 Computing probabilities A family has three children. Denoting a boy by B and a...
-
A quiz consists of three truefalse questions and two multiple-choice questions with five choices each. How many different sets of answers are there?

Study smarter with the SolutionInn App