

Overview As a fund manager, you are aware that the recent Royal Commission into Misconduct in...
Fantastic news! We've Found the answer you've been seeking!
Question:


Transcribed Image Text:
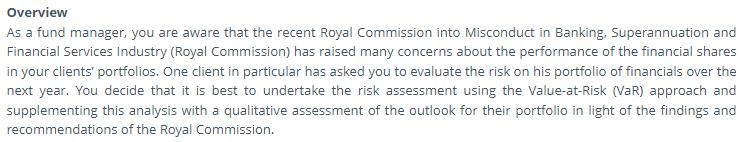
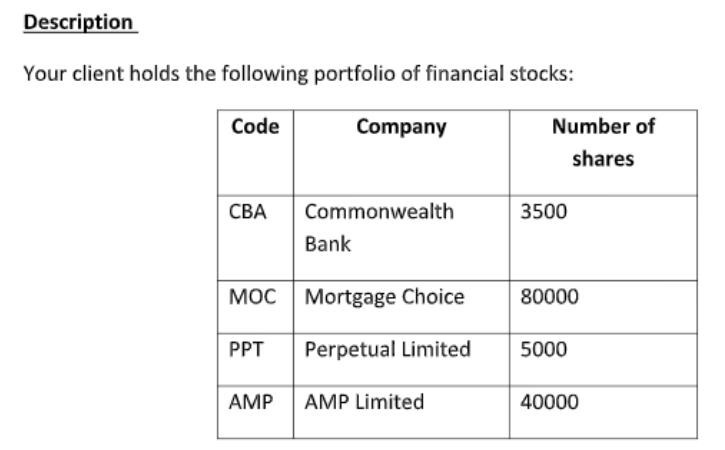
Overview As a fund manager, you are aware that the recent Royal Commission into Misconduct in Banking, Superannuation and Financial Services Industry (Royal Commission) has raised many concerns about the performance of the financial shares in your clients' portfolios. One client in particular has asked you to evaluate the risk on his portfolio of financials over the next year. You decide that it is best to undertake the risk assessment using the Value-at-Risk (VaR) approach and supplementing this analysis with a qualitative assessment of the outlook for their portfolio in light of the findings and recommendations of the Royal Commission. Description Your client holds the following portfolio of financial stocks: Company Code CBA PPT Commonwealth MOC Mortgage Choice Perpetual Limited AMP Bank AMP Limited Number of shares 3500 80000 5000 40000 Your task is to undertake a quantitative and qualitative assessment of the risk of the client's portfolio for the next year. With that in mind, you decide to address the following questions: (a) Calculate the VaR (99%) over the next 252 trading days as at immediately before the commencement of trading on March 1, 2019 You are aware of two methods which can be used to complete your VaR assessment: (a) the normal distribution method using the exponentially weighted moving average (EWMA) model to estimate the variances and covariances of the assets in the portfolio; or (b) historical simulation based on a rolling window. Both methods require choosing parameters to assign weight to past data: for the EWMA and the window length for the historical simulation. You decide to consider the following model specifications: EWMA-1 EWMA-2 Historical Simulation - 1 Historical Simulation - 2 for both variance and covariance. for variance and for covariance. Rolling window with 252 trading days. Rolling window with 100 trading days. This leaves you with 4 possible models that could be used to provide the VaR measure asked for above. You must choose the most appropriate model, explain why your model is the most viable choice, and report the associated VaR (as a percentage). To inform your decision of which to use, you need to backtest the four models by calculating 1-day VaR(99%) and comparing the actual number of exceedances with the Basel Traffic Lights to determine if any models should be excluded on this basis. Consistent with the Basel framework, you should use a rolling 252 trading day window to compute the number of exceedances in the last year. In your analysis, you should also compare the actual number of exceedances with what was expected to distinguish between any models that pass the Basel test. Once you have justified your choice of model, use it to estimate the VaR (99%) over the next year (252 trading days) as at immediately before the commencement of trading on March 1, 2019. This part of the assignment is quite mechanical and can get quite tricky. However, once you've finally got the correct formulae, you can copy most of them across/down to save time (just be careful when doing so). Here is a list of the tasks you will need to perform (in order): 1. Calculate the returns on the individual stocks as well as the portfolio: 2. Find the variances of the returns for each stock, as well as the covariances of the returns between the assets in the portfolio in accordance with the EWMA models specified. (Hint: This is perhaps the hardest and most time-consuming part of the calculations, so particular care should be taken here. You can have a look at how EWMA is done in the "VaR - ASX200" and "Portfolio Variance" spreadsheets, which are available in Assignment Resources, and think about how you might adapt them for the assignment. Since variance and covariance are time-varying, you should have a unique estimate of them for each trading day. In addition, since there are four stocks in the portfolio, there are 16 variance/covariance terms to consider (10 unique terms, given the variance/covariance matrix is symmetrical). Since there are two EWMA models and EWMA2 is only asking you to change the lambda for covariance, you should have at least 16 columns of variance/covariance estimates); 3. Using your answers in (2), calculate the variance of the portfolio for each day; 4. Calculate the Portfolio VaR according to each model for each day; 5. Calculate the actual number of exceedances, and compare them to the Basel Traffic Lights framework; 6. Compare the actual number of exceedances with what was expected; 7. Once you have found the preferred model, justify why you chose it and use it to report the VaR(99%) for the next 252 trading days. (b) Do you believe your VaR estimate accurately represents the downside risk (risk of loss) of the portfolio? This is the subjective part of the task, where you are required to justify whether your estimate of VaR represents the true downside risk of the portfolio. To avoid confusion and to streamline your thought processes, you should have regard to two (2) potential risk factors such as 'black swans' or even reasonably foreseeable events arising only as a result of the Royal Commission. This will require you to undertake some independent research on the individual stocks, as well as some of the potential regulations/interventions that might/will affect those stocks. You should also familiarise yourself with some of the relevant recommendations made in the final report, which you can find here. You can also read some news articles, press releases and blogs to gain an understanding of the issues. You should note that it is not enough to simply state the issues that may not be captured in your VaR model. You need to provide strong justification as to why you feel the way you do about the VaR estimate based on logical arguments and appropriate references. You should also attempt to highlight the effects that your qualitative findings have on your quantitative risk assessment. However, you do not have to physically quantify it. As a rough guide, this part should be approximately 500 words in length, give or take 10%. Do not simply state the limitations of VaR models generally, as you will not be awarded any marks for this. Instead, you are rewarded for showing an understanding of current affairs and its application to the portfolio, being able to identify potential qualitative factors that might occur in the future (futuristic thinking), assessing its impact on your analysis, and providing strong justification for your analysis. Overview As a fund manager, you are aware that the recent Royal Commission into Misconduct in Banking, Superannuation and Financial Services Industry (Royal Commission) has raised many concerns about the performance of the financial shares in your clients' portfolios. One client in particular has asked you to evaluate the risk on his portfolio of financials over the next year. You decide that it is best to undertake the risk assessment using the Value-at-Risk (VaR) approach and supplementing this analysis with a qualitative assessment of the outlook for their portfolio in light of the findings and recommendations of the Royal Commission. Description Your client holds the following portfolio of financial stocks: Company Code CBA PPT Commonwealth MOC Mortgage Choice Perpetual Limited AMP Bank AMP Limited Number of shares 3500 80000 5000 40000 Your task is to undertake a quantitative and qualitative assessment of the risk of the client's portfolio for the next year. With that in mind, you decide to address the following questions: (a) Calculate the VaR (99%) over the next 252 trading days as at immediately before the commencement of trading on March 1, 2019 You are aware of two methods which can be used to complete your VaR assessment: (a) the normal distribution method using the exponentially weighted moving average (EWMA) model to estimate the variances and covariances of the assets in the portfolio; or (b) historical simulation based on a rolling window. Both methods require choosing parameters to assign weight to past data: for the EWMA and the window length for the historical simulation. You decide to consider the following model specifications: EWMA-1 EWMA-2 Historical Simulation - 1 Historical Simulation - 2 for both variance and covariance. for variance and for covariance. Rolling window with 252 trading days. Rolling window with 100 trading days. This leaves you with 4 possible models that could be used to provide the VaR measure asked for above. You must choose the most appropriate model, explain why your model is the most viable choice, and report the associated VaR (as a percentage). To inform your decision of which to use, you need to backtest the four models by calculating 1-day VaR(99%) and comparing the actual number of exceedances with the Basel Traffic Lights to determine if any models should be excluded on this basis. Consistent with the Basel framework, you should use a rolling 252 trading day window to compute the number of exceedances in the last year. In your analysis, you should also compare the actual number of exceedances with what was expected to distinguish between any models that pass the Basel test. Once you have justified your choice of model, use it to estimate the VaR (99%) over the next year (252 trading days) as at immediately before the commencement of trading on March 1, 2019. This part of the assignment is quite mechanical and can get quite tricky. However, once you've finally got the correct formulae, you can copy most of them across/down to save time (just be careful when doing so). Here is a list of the tasks you will need to perform (in order): 1. Calculate the returns on the individual stocks as well as the portfolio: 2. Find the variances of the returns for each stock, as well as the covariances of the returns between the assets in the portfolio in accordance with the EWMA models specified. (Hint: This is perhaps the hardest and most time-consuming part of the calculations, so particular care should be taken here. You can have a look at how EWMA is done in the "VaR - ASX200" and "Portfolio Variance" spreadsheets, which are available in Assignment Resources, and think about how you might adapt them for the assignment. Since variance and covariance are time-varying, you should have a unique estimate of them for each trading day. In addition, since there are four stocks in the portfolio, there are 16 variance/covariance terms to consider (10 unique terms, given the variance/covariance matrix is symmetrical). Since there are two EWMA models and EWMA2 is only asking you to change the lambda for covariance, you should have at least 16 columns of variance/covariance estimates); 3. Using your answers in (2), calculate the variance of the portfolio for each day; 4. Calculate the Portfolio VaR according to each model for each day; 5. Calculate the actual number of exceedances, and compare them to the Basel Traffic Lights framework; 6. Compare the actual number of exceedances with what was expected; 7. Once you have found the preferred model, justify why you chose it and use it to report the VaR(99%) for the next 252 trading days. (b) Do you believe your VaR estimate accurately represents the downside risk (risk of loss) of the portfolio? This is the subjective part of the task, where you are required to justify whether your estimate of VaR represents the true downside risk of the portfolio. To avoid confusion and to streamline your thought processes, you should have regard to two (2) potential risk factors such as 'black swans' or even reasonably foreseeable events arising only as a result of the Royal Commission. This will require you to undertake some independent research on the individual stocks, as well as some of the potential regulations/interventions that might/will affect those stocks. You should also familiarise yourself with some of the relevant recommendations made in the final report, which you can find here. You can also read some news articles, press releases and blogs to gain an understanding of the issues. You should note that it is not enough to simply state the issues that may not be captured in your VaR model. You need to provide strong justification as to why you feel the way you do about the VaR estimate based on logical arguments and appropriate references. You should also attempt to highlight the effects that your qualitative findings have on your quantitative risk assessment. However, you do not have to physically quantify it. As a rough guide, this part should be approximately 500 words in length, give or take 10%. Do not simply state the limitations of VaR models generally, as you will not be awarded any marks for this. Instead, you are rewarded for showing an understanding of current affairs and its application to the portfolio, being able to identify potential qualitative factors that might occur in the future (futuristic thinking), assessing its impact on your analysis, and providing strong justification for your analysis.
Expert Answer:
Answer rating: 100% (QA)
Calculate the returns on the individual stocks as well as the portfolio Code CBA Company Commonwealth Bank Number of shares 3500 3500 times 7000 245000 3500 times 7200 252000 245000 252000 7000 700024... View the full answer

Related Book For 
Microeconomics Theory and Applications
ISBN: 978-1118758878
12th edition
Authors: Edgar K. Browning, Mark A. Zupan
Posted Date:
Students also viewed these banking questions
-
A fellow student states that it is best to stop studying once you reach the point of diminishing returns with regard to the number of hours spent studying. Assess the validity of her statement.
-
Multiple-Choice Questions 1. For performance reporting, it is best to compare actual costs with budgeted costs using a. Short-term budgets. b. Static budgets. c. Master budgets. d. Flexible budgets....
-
An individual wishes to invest $5000 over the next year in two types of investment: Investment A yields 5% and investment B yields 8%. Market research recommends an allocation of at least 25% in A...
-
2. C. b. d. e. a. A proposed public project would produce the following pattern of individual benefits and costs. Revise only the cost shares of individuals C and E to meet the Pareto Criterion. (7...
-
Bubbles reads that in study A the zobt = +1.97, p < .05. She also reads that in study B the zobt = +14.21, p < .0001. (a) She concludes that the results of study B are way beyond the critical value...
-
Calculate the standard Gibbs free energy change and the equilibrium constant at 1 bar and \(298.15 \mathrm{~K}\) for the ammonia synthesis reaction \[ \mathrm{C}_{2} \mathrm{H}_{5}...
-
Speegleville Marina needs to raise \(\$ 1\) million to expand. Speegleville's president is considering two plans: - Plan A: Issue \(\$ 1,000,000\) of \(8 \%\) bonds payable to borrow the money - Plan...
-
The Sherill Utility District was recently established. Its balance sheet, after one year, is presented below. Note the following additional information: ¢ The general fund received all of its...
-
A building was constructed last year for Agro Co. for use as a production facility. Construction began on January 1 and was completed on December 31. The payments to the contractor were as follows....
-
4. Distinct Items There is a list of items in the shopping cart, each having a cost associated with it. There are n items, the cost of the ith item is / dollars and m items have already been bought...
-
1. Two firms serve a market simultaneously where demand is P = 40 - 5(Q+Q2). Each firm's marginal cost is 20. a) Suppose each firm maximizes its own profit by competing on quantities. Find an...
-
Review the major theoretical models , including the neuroscience, evolutionary, behavior genetics, psychodynamic, behavioral, cognitive, and social-cultural theoretical models. Think about the major...
-
So how is loyalty built? What makes you use price as a signal? What is it about price that makes it a cue for us and how does it relate to brand ?
-
1: Provided in the template below are elements of Quality Areas 1 and 6 of the National Quality Standard (NQS). Access and review each of the Quality Areas in the ACECQA website, and for each of the...
-
How would you define consumer buying behavior? Draw the model of consumer behavior and explain the factors affecting consumer buying behavior with example.
-
Explain the role of incident investigation in PSM. How does root cause analysis (RCA) contribute to continuous improvement in process safety, and what methodologies are commonly used to identify the...
-
Painter Corporation was organized by five individuals on January 1 of the current year. At the end of January of the current year, the following monthly financial data are available: Total revenues...
-
The Higher the time period of the financial security the higher the. ............... risk. O a. Maturity O b. Default and Maturity Oc. Default O d. Liquidity
-
Suppose that Thurston, a color- blind consumer, has $ 80 to spend on either pink or lime- green sweaters. Thurston does not care what color sweater he wears but deems it very important to buy as many...
-
Explain why the Social Security program reduces before-tax wage rates and why this effect is greater over the long run than in the short run.
-
Consider your time spent studying as an input in the production of total points on an economics test. Assume that other inputs (what could they be?) are not varied. Draw the total, average, and...
-
Assume that a population has the following characteristics: Number of items in the population-300 Population recorded amount-$600,000 Sample size-100
-
The following list of tests is typical of those usually performed by auditors in gathering evidence to ascertain the fairness of financial statement balances. For each listed test, indicate whether...
-
What is the purpose of obtaining authenticated deposit slips from the bank? Explain the limitations on the effectiveness of this procedure.

Study smarter with the SolutionInn App