

Problem 5: Correlation Many of us are interested in determining whether one thing is related to...
Fantastic news! We've Found the answer you've been seeking!
Question:
Transcribed Image Text:
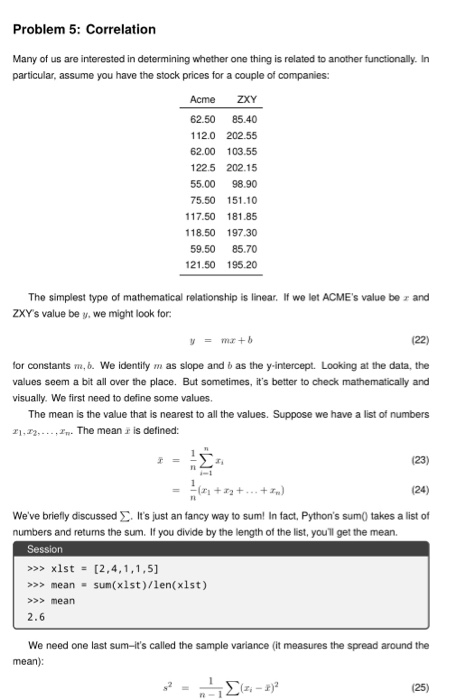
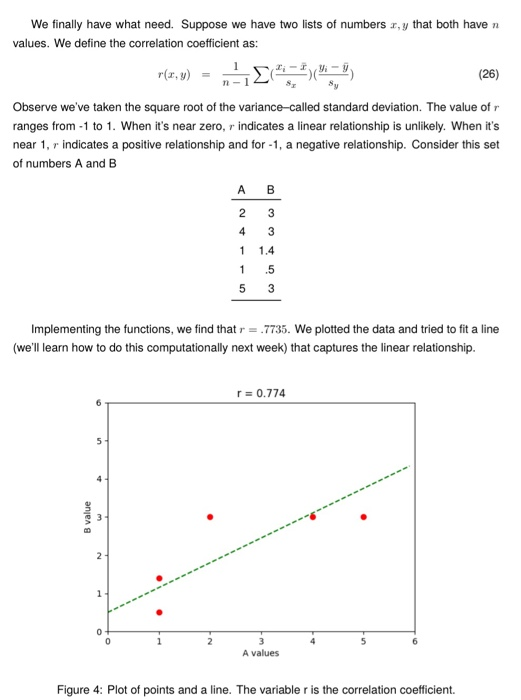
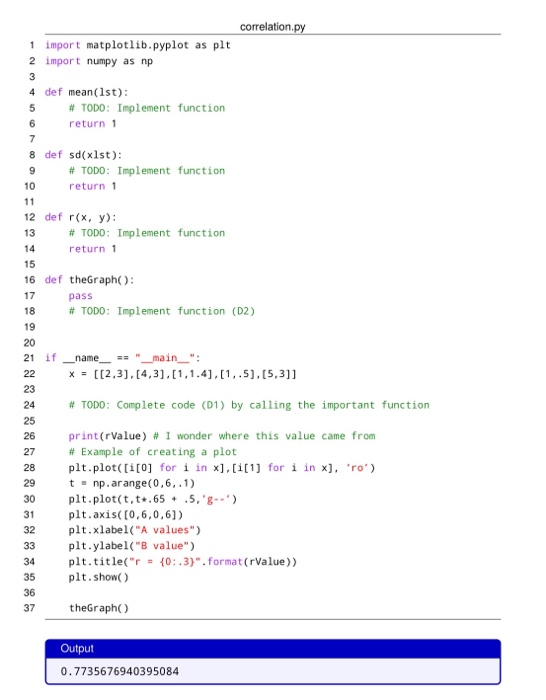
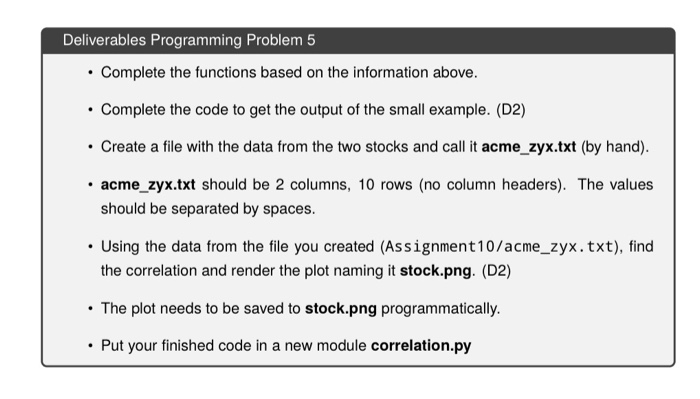
Problem 5: Correlation Many of us are interested in determining whether one thing is related to another functionally. In particular, assume you have the stock prices for a couple of companies: Acme ZXY 62.50 85.40 112.0 202.55 62.00 103.55 122.5 202.15 55.00 98.90 75.50 151.10 117.50 181.85 118.50 197.30 59.50 85.70 121.50 195.20 The simplest type of mathematical relationship is linear. If we let ACME's value bez and ZXY's value be y, we might look for: y = mx + b (22) for constants m, b. We identify mas slope and as the y-intercept. Looking at the data, the values seem a bit all over the place. But sometimes, it's better to check mathematically and visually. We first need to define some values. The mean is the value that is nearest to all the values. Suppose we have a list of numbers 21,22,... The mean is defined: EM- 2₂ (23) +2₂+...+2) (24) We've briefly discussed. It's just an fancy way to sum! In fact, Python's sum() takes a list of numbers and returns the sum. If you divide by the length of the list, you'll get the mean. Session >>> x1st = [2,4,1,1,5] >>> mean = sum(x1st)/len(x1st) >>> mean 2.6 We need one last sum-it's called the sample variance (it measures the spread around the mean): (2-2)² (25) We finally have what need. Suppose we have two lists of numbers x,y that both have n values. We define the correlation coefficient as: r(x,y) (4) (26) Observe we've taken the square root of the variance-called standard deviation. The value of r ranges from 1 to 1. When it's near zero, r indicates a linear relationship is unlikely. When it's near 1, r indicates a positive relationship and for -1, a negative relationship. Consider this set of numbers A and B B value 5 Implementing the functions, we find that r = .7735. We plotted the data and tried to fit a line (we'll learn how to do this computationally next week) that captures the linear relationship. at m 2 A 2 4 1 1 1 5 B 3 3 1.4 .5 3 r=0.774 3 A values 6 Figure 4: Plot of points and a line. The variable r is the correlation coefficient. 1 import matplotlib.pyplot as plt 2 import numpy as np 3 4 def mean(1st): 5 6 7 8 def sd(xlst): 9 10 #TODO: Implement function return 1 11 12 def r(x, y): 13 27 28 # TODO: Implement function return 1 14 15 16 def theGraph(): 17 18 19 20 21 if _name == "__main__": 22 23 24 25 26 32 33 34 35 36 37 # TODO: Implement function return 1 pass # TODO: Implement function (D2) 29 30 plt.plot(t, t.65.5,'g') 31 plt.axis([0,6,0,61) x= [[2,3], [4,3],[1,1.4],[1,.5], [5,3]] # TODO: Complete code (D1) by calling the important function print (rValue) # I wonder where this value came from # Example of creating a plot plt.plot([i[0] for i in x], [i[1] for i in x], 'ro') t = np.arange(0,6,.1) correlation.py plt.xlabel("A values") plt.ylabel("B value") plt.title("r= (0:.3)". format (rValue)) plt.show() the Graph() Output 0.7735676940395084 Deliverables Programming Problem 5 • Complete the functions based on the information above. • Complete the code to get the output of the small example. (D2) Create a file with the data from the two stocks and call it acme_zyx.txt (by hand). • acme_zyx.txt should be 2 columns, 10 rows (no column headers). The values should be separated by spaces. • Using the data from the file you created (Assignment10/acme_zyx.txt), find the correlation and render the plot naming it stock.png. (D2) • The plot needs to be saved to stock.png programmatically. • Put your finished code in a new module correlation.py Problem 5: Correlation Many of us are interested in determining whether one thing is related to another functionally. In particular, assume you have the stock prices for a couple of companies: Acme ZXY 62.50 85.40 112.0 202.55 62.00 103.55 122.5 202.15 55.00 98.90 75.50 151.10 117.50 181.85 118.50 197.30 59.50 85.70 121.50 195.20 The simplest type of mathematical relationship is linear. If we let ACME's value bez and ZXY's value be y, we might look for: y = mx + b (22) for constants m, b. We identify mas slope and as the y-intercept. Looking at the data, the values seem a bit all over the place. But sometimes, it's better to check mathematically and visually. We first need to define some values. The mean is the value that is nearest to all the values. Suppose we have a list of numbers 21,22,... The mean is defined: EM- 2₂ (23) +2₂+...+2) (24) We've briefly discussed. It's just an fancy way to sum! In fact, Python's sum() takes a list of numbers and returns the sum. If you divide by the length of the list, you'll get the mean. Session >>> x1st = [2,4,1,1,5] >>> mean = sum(x1st)/len(x1st) >>> mean 2.6 We need one last sum-it's called the sample variance (it measures the spread around the mean): (2-2)² (25) We finally have what need. Suppose we have two lists of numbers x,y that both have n values. We define the correlation coefficient as: r(x,y) (4) (26) Observe we've taken the square root of the variance-called standard deviation. The value of r ranges from 1 to 1. When it's near zero, r indicates a linear relationship is unlikely. When it's near 1, r indicates a positive relationship and for -1, a negative relationship. Consider this set of numbers A and B B value 5 Implementing the functions, we find that r = .7735. We plotted the data and tried to fit a line (we'll learn how to do this computationally next week) that captures the linear relationship. at m 2 A 2 4 1 1 1 5 B 3 3 1.4 .5 3 r=0.774 3 A values 6 Figure 4: Plot of points and a line. The variable r is the correlation coefficient. 1 import matplotlib.pyplot as plt 2 import numpy as np 3 4 def mean(1st): 5 6 7 8 def sd(xlst): 9 10 #TODO: Implement function return 1 11 12 def r(x, y): 13 27 28 # TODO: Implement function return 1 14 15 16 def theGraph(): 17 18 19 20 21 if _name == "__main__": 22 23 24 25 26 32 33 34 35 36 37 # TODO: Implement function return 1 pass # TODO: Implement function (D2) 29 30 plt.plot(t, t.65.5,'g') 31 plt.axis([0,6,0,61) x= [[2,3], [4,3],[1,1.4],[1,.5], [5,3]] # TODO: Complete code (D1) by calling the important function print (rValue) # I wonder where this value came from # Example of creating a plot plt.plot([i[0] for i in x], [i[1] for i in x], 'ro') t = np.arange(0,6,.1) correlation.py plt.xlabel("A values") plt.ylabel("B value") plt.title("r= (0:.3)". format (rValue)) plt.show() the Graph() Output 0.7735676940395084 Deliverables Programming Problem 5 • Complete the functions based on the information above. • Complete the code to get the output of the small example. (D2) Create a file with the data from the two stocks and call it acme_zyx.txt (by hand). • acme_zyx.txt should be 2 columns, 10 rows (no column headers). The values should be separated by spaces. • Using the data from the file you created (Assignment10/acme_zyx.txt), find the correlation and render the plot naming it stock.png. (D2) • The plot needs to be saved to stock.png programmatically. • Put your finished code in a new module correlation.py
Expert Answer:
Answer rating: 100% (QA)
Solution import numpy as np import matplotlibpyplot as plt ... View the full answer

Related Book For 

Elementary Statistics Picturing the World
ISBN: 978-0321911216
6th edition
Authors: Ron Larson, Betsy Farber
Posted Date:
Students also viewed these programming questions
-
A random sample of the closing stock prices for a company in a recent year is listed. Assume that is $2.62. Use the information to construct the 90% and 99% confidence intervals for the population...
-
The following table lists the stock prices for Microsoft from 1989 to 1998. The company did not pay any dividends during the period Year Price (dollars) 1989 .......... 1.20 1990 .......... 2.09 1991...
-
The following are the closing stock prices for a pharmaceutical firm over the past two weeks. a. Specify the competing hypotheses to determine whether the median stock price is greater than $61.25....
-
What is the relationship between group norms and group cohesiveness? What roles do both cohesiveness and norms plan in shaping group performance?
-
ABM Corporation experienced the following transactions during the year ended December 31, 20X8: a. ABM sold products for $53 billion. Company management believes the value of these products is...
-
The intake pipe of a 100-gallon tank has a flow rate of 10 gallons per minute, and two drainpipes have flow rates of 5 gallons per minute each. The figure shows the volume V of fluid in the tank as a...
-
Go to the St. Louis Federal Reserve FRED database, and find data on real GDP (GDPC1), potential GDP (GDPPOT), and the unemployment rate (UNRATE) from 1960 to the most recent period. For the...
-
Revenue and production budgets. (CPA, adapted) The Scarborough Corporation manufactures and sells two products: Thingone and Thingtwo. In July 2009, Scarboroughs budget department gathered the...
-
4. A monopolist is faced with the inverse demand function P(Q) denoting the price when output is Q. The monopolist has a constant average cost k per unit produced. (a) Find the profit function (Q),...
-
Mirza Manufacturing makes four electronic products, each of which comprises three main materials: magnet, wiring, and casing. The products are shipped to three distribution centers in North America,...
-
A co-worker makes a joke with you about a client, saying they 'dress up' on the days you are on shift. The next week you receive a friend request on a social networking site from that client - do you...
-
Provide one consideration management should take into account when assessing the going concern assumption.
-
Why must executives buy into the multiproject Critical Chain approach?
-
What four functions should be segregated with respect to inventory?
-
Refer to Table 16.2 and assume that the Feds reserve ratio is 10 percent and the economy is in a severe recession. Also suppose that the commercial banks are hoarding all excess reserves (not lending...
-
What is completeness with respect to inventory?
-
A Project has a PV of $60,000 at the status date of 10 months and a BAC of $185,000 at the end of the project. The Project schedule is 19 months and at the status date AC is $115,000 and EV for the...
-
Explain briefly what is meant by electronic data interchange (EDI). How does EDI affect a companys audit trail?
-
An automobile manufacturer finds that 1 in every 2500 automobiles produced has a particular manufacturing defect. (a) Use a binomial distribution to find the probability of finding 4 cars with the...
-
A misleading graph is a statistical graph that is not drawn appropriately. This type of graph can misrepresent data and lead to false conclusions. In Exercises 39, (a) Explain why the graph is...
-
A company that makes cola drinks states that the mean caffeine content per 12-ounce bottle of cola is 40 milligrams. You want to test this claim. During your tests, you find that a random sample of...
-
From the following account balances of Josland at 31 December 20X2 prepare a balance sheet in both T-format and narrative classified format. Cash at bank $113 500 Accounts receivable (net) 52 400...
-
Flightboat Ltd borrowed $60 000, issued $20 000 worth of ordinary shares, paid a dividend of $50 000 and the owner withdrew $10 000 in cash. What was Flightboats net cash provided (used) by financing...
-
Obtain the Woolworths 2018 annual report and answer the following questions. Required: 1 How does Woolworths report on its corporate responsibility? 2 List three important points the CEO makes...

Study smarter with the SolutionInn App