

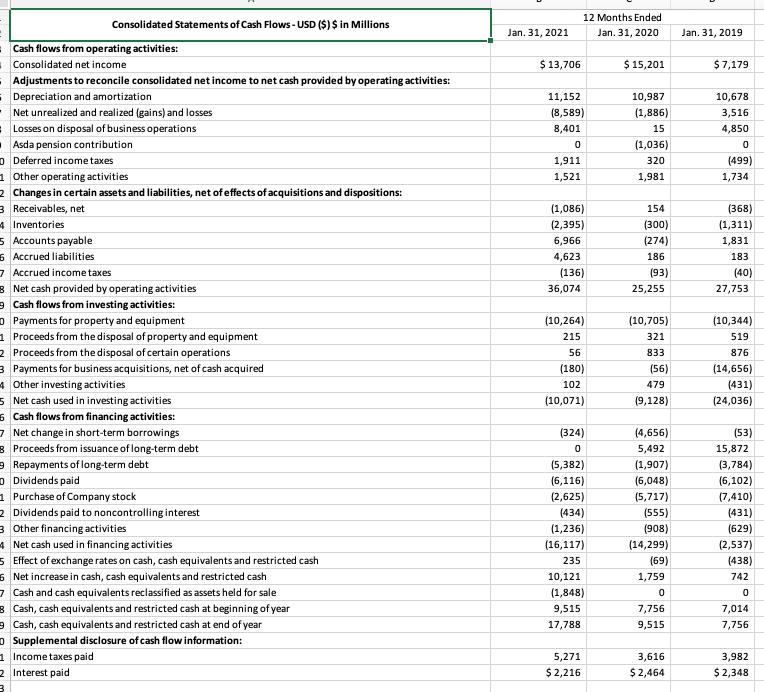
Ratio analysis for the ratios shown in Table 1 in the Guide to Case Analysis (CA) of
Fantastic news! We've Found the answer you've been seeking!
Question:
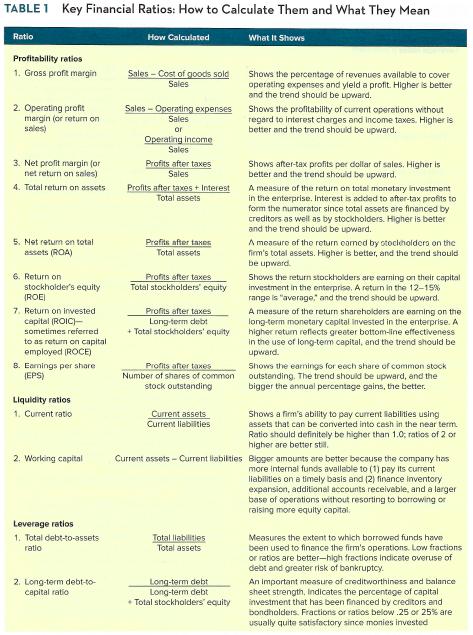
- Ratio analysis for the ratios shown in Table 1 in the Guide to Case Analysis (CA) of the textbook:
- Profitability ratios
- Liquidity ratios
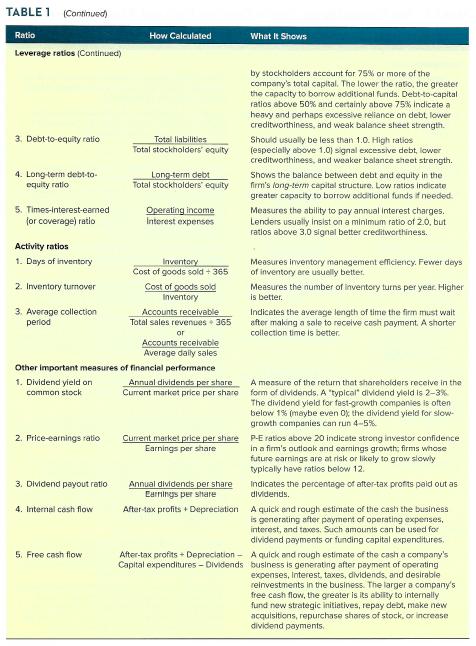
- Leverage ratios
- Activity ratios
- Price-to-earnings ratio
- The changes between years are included in the calculations
Expert Answer:
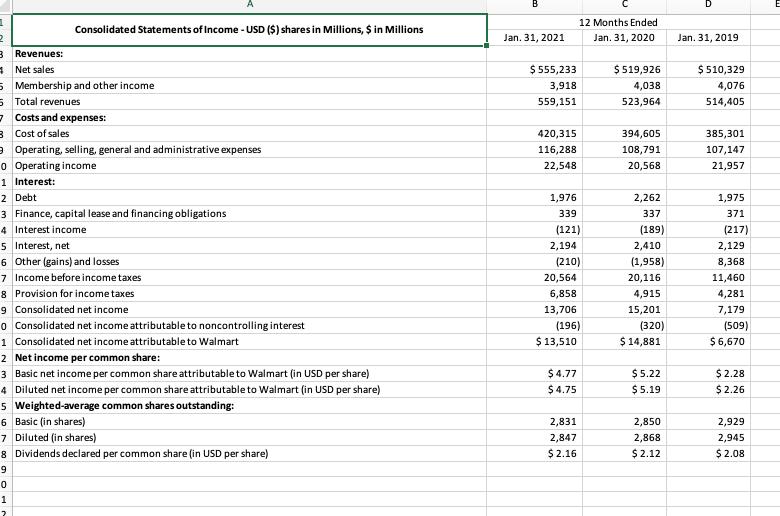
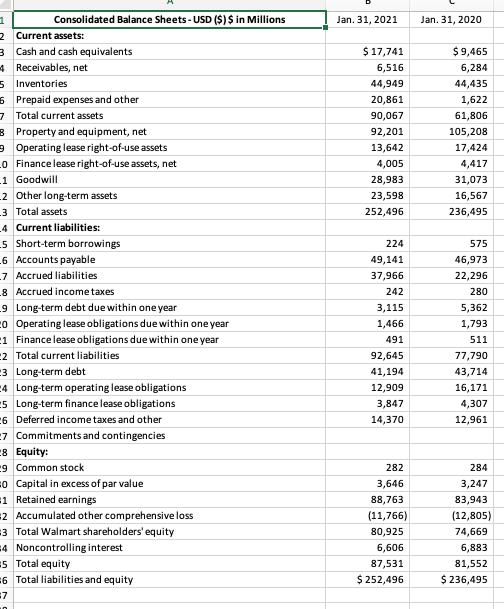
Sales 55523300 51992600 51032900 COGS 42031500 39460500 38530100 Operating Income 2254800 2056800 21... View the full answer

Related Book For 
Posted Date:
