

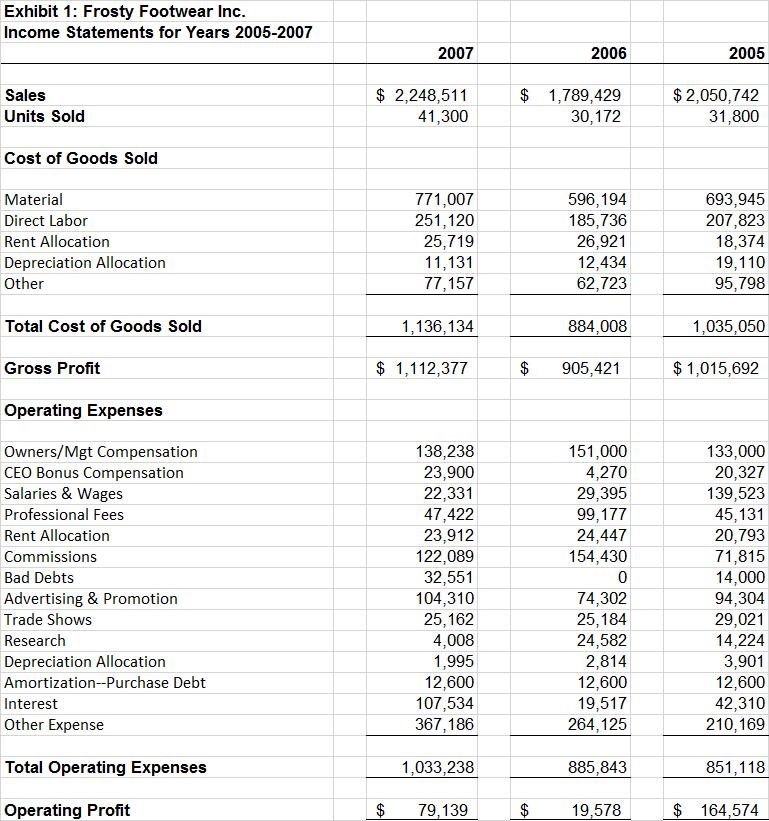
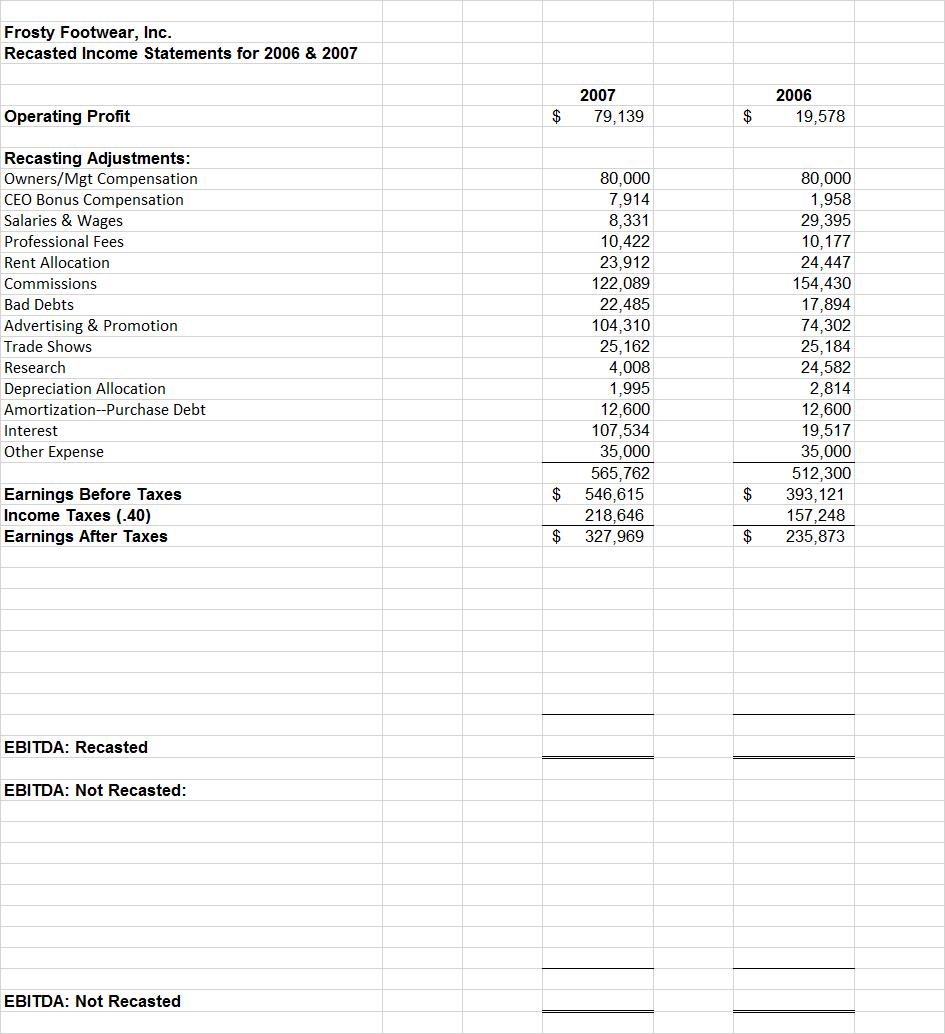
Recast Frosty Footwear's income statements for the last two years considering the potential income statement adjustments under
Fantastic news! We've Found the answer you've been seeking!
Question:
Recast Frosty Footwear's income statements for the last two years considering the potential income statement adjustments under the income approach to business value. Calculate the Non-Recasted and Recasted EBITDA.
Expert Answer:

Related Book For 
Introduction to Corporate Finance What Companies Do
ISBN: 978-1111222284
3rd edition
Authors: John Graham, Scott Smart
Posted Date:
