Refer to the Apple financial statements on the last page of this exam. Imagine that Apple is
Fantastic news! We've Found the answer you've been seeking!
Question:
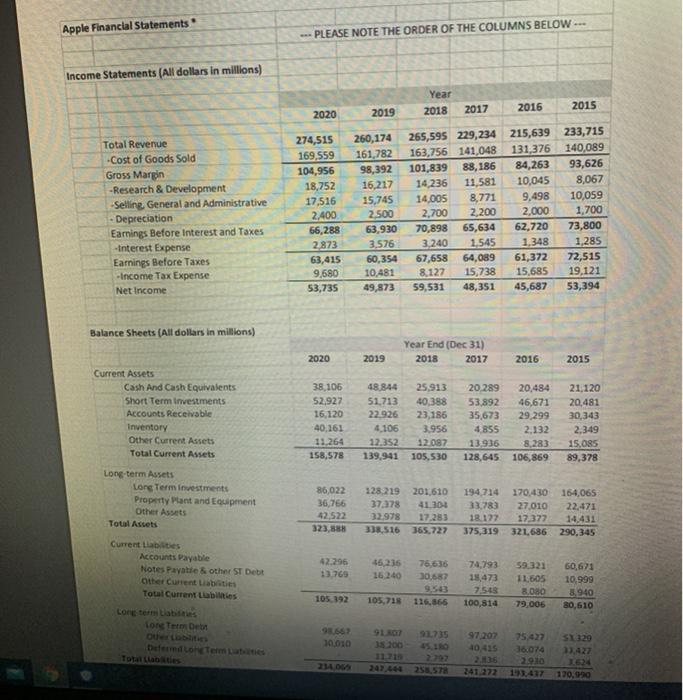
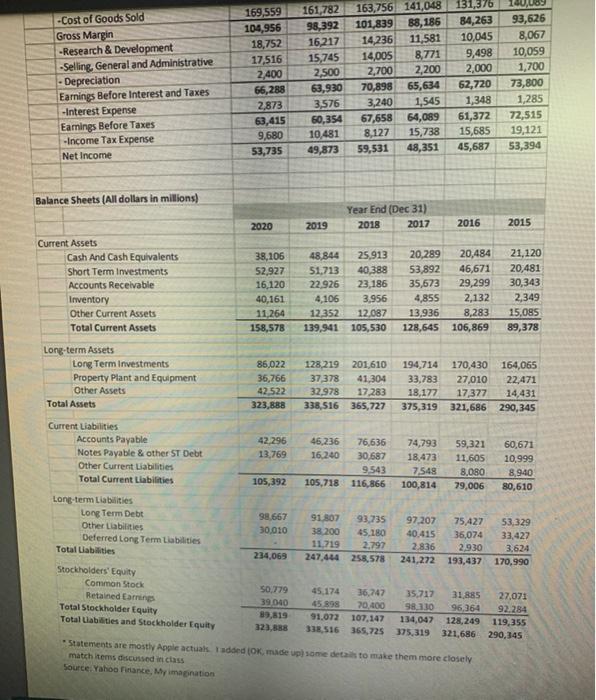
Refer to the Apple financial statements on the last page of this exam. Imagine that Apple is planning for 2021 and they hope to achieve Net Income of 75,000. (This is up from 53735 in 2020.) Assuming the following, how much revenue (sales) will they need to generate? Their tax rate will be 29% Interest expense will be 4,000. Depreciation will be 3,000 Selling, General and Administrative will be 14,500 and Research and Development 15,000 Variable costs will be 64% of revenue.
Transcribed Image Text:
Apple Financial Statements Income Statements (All dollars in millions) Total Revenue -Cost of Goods Sold Gross Margin -Research & Development -Selling, General and Administrative Depreciation Earnings Before Interest and Taxes -Interest Expense Earnings Before Taxes -Income Tax Expense Net Income Balance Sheets (All dollars in millions) Current Assets Cash And Cash Equivalents Short Term Investments Accounts Receivable Inventory Other Current Assets Total Current Assets Long-term Assets Long Term Investments Property Plant and Equipment Other Assets Total Assets Current Liabilities Accounts Payable Notes Payable & other ST Debt Other Current Liabilities Total Current Liabilities Long term Liabidities Long Term Debt Other Liabilities Deferred Long Term Latiities Total Llabilities --PLEASE NOTE THE ORDER OF THE COLUMNS BELOW ---. 2020 2020 38,106 52,927 16,120 40,161 11,264 158,578 274,515 260,174 169,559 161,782 104,956 98,392 101,839 18,752 16,217 14,236 17,516 15,745 14,005 8,771 2,400 2,500 2,700 2,200 63,930 70,898 65,634 62,720 66,288 2,873 3,576 3,240 1,545 1,348 63,415 60,354 67,658 64,089 61,372 9,680 10,481 8,127 15,738 15,685 53,735 49,873 59,531 48,351 45,687 2019 42.296 13,769 98.667 1,010 2019 234,069 Year 2017 2016 265,595 229,234 215,639 233,715 163,756 141,048 131,376 140,089 84,263 93,626 10,045 8,067 2018 86,022 128,219 201,610 36,766 37,378 41.304 42,522 323,888 32,978 17,283 338,516 365,727 Year End (Dec 31) 2018 2017 91.807 38.200 88,186 11,581 46,236 76,636 16,240 30,687 9,543 105,392 105,718 116,866 100,814 48,844 25,913 20,289 20,484 51,713 40,388 53,892 46,671 22,926 23,186 35,673 29,299 4,106 3,956 4,855 12.352 12.087 13,936 2,132 8,283 139,941 105,530 128,645 106,869 9,498 2,000 2016 2015 10,059 1,700 73,800 1,285 72,515 19,121 53,394 2015 21,120 20,481 30,343 2,349 15,085 89,378 194,714 170,430 164,065 33,783 27,010 22,471 18.177 17,377 14,431 375,319 321,686 290,345 74,793 59.321 60,671 18,473 11,605 7,548 8,080 79,006 10,999 8,940 80,610 93.735 97,207 75427 SX. 329 45,180 40,415 36.074 33,427 2.797 2.836 2.930 3.624 247,444 258,578 241.272 193,437 170,990 Apple Financial Statements Income Statements (All dollars in millions) Total Revenue -Cost of Goods Sold Gross Margin -Research & Development -Selling, General and Administrative Depreciation Earnings Before Interest and Taxes -Interest Expense Earnings Before Taxes -Income Tax Expense Net Income Balance Sheets (All dollars in millions) Current Assets Cash And Cash Equivalents Short Term Investments Accounts Receivable Inventory Other Current Assets Total Current Assets Long-term Assets Long Term Investments Property Plant and Equipment Other Assets Total Assets Current Liabilities Accounts Payable Notes Payable & other ST Debt Other Current Liabilities Total Current Liabilities Long term Liabidities Long Term Debt Other Liabilities Deferred Long Term Latiities Total Llabilities --PLEASE NOTE THE ORDER OF THE COLUMNS BELOW ---. 2020 2020 38,106 52,927 16,120 40,161 11,264 158,578 274,515 260,174 169,559 161,782 104,956 98,392 101,839 18,752 16,217 14,236 17,516 15,745 14,005 8,771 2,400 2,500 2,700 2,200 63,930 70,898 65,634 62,720 66,288 2,873 3,576 3,240 1,545 1,348 63,415 60,354 67,658 64,089 61,372 9,680 10,481 8,127 15,738 15,685 53,735 49,873 59,531 48,351 45,687 2019 42.296 13,769 98.667 1,010 2019 234,069 Year 2017 2016 265,595 229,234 215,639 233,715 163,756 141,048 131,376 140,089 84,263 93,626 10,045 8,067 2018 86,022 128,219 201,610 36,766 37,378 41.304 42,522 323,888 32,978 17,283 338,516 365,727 Year End (Dec 31) 2018 2017 91.807 38.200 88,186 11,581 46,236 76,636 16,240 30,687 9,543 105,392 105,718 116,866 100,814 48,844 25,913 20,289 20,484 51,713 40,388 53,892 46,671 22,926 23,186 35,673 29,299 4,106 3,956 4,855 12.352 12.087 13,936 2,132 8,283 139,941 105,530 128,645 106,869 9,498 2,000 2016 2015 10,059 1,700 73,800 1,285 72,515 19,121 53,394 2015 21,120 20,481 30,343 2,349 15,085 89,378 194,714 170,430 164,065 33,783 27,010 22,471 18.177 17,377 14,431 375,319 321,686 290,345 74,793 59.321 60,671 18,473 11,605 7,548 8,080 79,006 10,999 8,940 80,610 93.735 97,207 75427 SX. 329 45,180 40,415 36.074 33,427 2.797 2.836 2.930 3.624 247,444 258,578 241.272 193,437 170,990 Apple Financial Statements Income Statements (All dollars in millions) Total Revenue -Cost of Goods Sold Gross Margin -Research & Development -Selling, General and Administrative Depreciation Earnings Before Interest and Taxes -Interest Expense Earnings Before Taxes -Income Tax Expense Net Income Balance Sheets (All dollars in millions) Current Assets Cash And Cash Equivalents Short Term Investments Accounts Receivable Inventory Other Current Assets Total Current Assets Long-term Assets Long Term Investments Property Plant and Equipment Other Assets Total Assets Current Liabilities Accounts Payable Notes Payable & other ST Debt Other Current Liabilities Total Current Liabilities Long term Liabidities Long Term Debt Other Liabilities Deferred Long Term Latiities Total Llabilities --PLEASE NOTE THE ORDER OF THE COLUMNS BELOW ---. 2020 2020 38,106 52,927 16,120 40,161 11,264 158,578 274,515 260,174 169,559 161,782 104,956 98,392 101,839 18,752 16,217 14,236 17,516 15,745 14,005 8,771 2,400 2,500 2,700 2,200 63,930 70,898 65,634 62,720 66,288 2,873 3,576 3,240 1,545 1,348 63,415 60,354 67,658 64,089 61,372 9,680 10,481 8,127 15,738 15,685 53,735 49,873 59,531 48,351 45,687 2019 42.296 13,769 98.667 1,010 2019 234,069 Year 2017 2016 265,595 229,234 215,639 233,715 163,756 141,048 131,376 140,089 84,263 93,626 10,045 8,067 2018 86,022 128,219 201,610 36,766 37,378 41.304 42,522 323,888 32,978 17,283 338,516 365,727 Year End (Dec 31) 2018 2017 91.807 38.200 88,186 11,581 46,236 76,636 16,240 30,687 9,543 105,392 105,718 116,866 100,814 48,844 25,913 20,289 20,484 51,713 40,388 53,892 46,671 22,926 23,186 35,673 29,299 4,106 3,956 4,855 12.352 12.087 13,936 2,132 8,283 139,941 105,530 128,645 106,869 9,498 2,000 2016 2015 10,059 1,700 73,800 1,285 72,515 19,121 53,394 2015 21,120 20,481 30,343 2,349 15,085 89,378 194,714 170,430 164,065 33,783 27,010 22,471 18.177 17,377 14,431 375,319 321,686 290,345 74,793 59.321 60,671 18,473 11,605 7,548 8,080 79,006 10,999 8,940 80,610 93.735 97,207 75427 SX. 329 45,180 40,415 36.074 33,427 2.797 2.836 2.930 3.624 247,444 258,578 241.272 193,437 170,990
Expert Answer:
Answer rating: 100% (QA)
To determine the revenue Apple needs to achieve a net income of 75000 million in 2021 we can work th... View the full answer
Related Book For
Financial Accounting
ISBN: 978-0134127620
11th edition
Authors: Walter Harrison, Charles Horngren, William Thomas, Wendy Tietz
Posted Date:
Students also viewed these accounting questions
-
The following is the balance sheet and income statement for YUM, Inc. (the company that operates Kentucky Fried Chicken and Pizza Hut), in condensed form, plus some information from the cash flow...
-
The following trial balance was drawn from the records of Havel Company as of October 1, 2018: Required a. Divide the class into groups, each with four or five students. Organize the groups into...
-
The uniform disk of mass m is rotating with an angular velocity of 0 when it is placed on the floor. Determine the time before it starts to roll without slipping. What is the angular velocity of the...
-
Based on a Survey of Consumer Payment Choice, researchers from the Federal Reserve Bank of Boston estimated that the average consumer, 18 years of age and older, held about $340 in currency. However,...
-
The average length of short hospital stays for men is slightly longer than that for women, 5.2 days versus 4.5 days. A random sample of recent hospital stays for both men and women revealed the...
-
Figure 2.86 shows a scatterplot illustrating three different variables from the dataset HappyPlanetIndex. The variable Happiness is a measure of the well-being of a country, with larger numbers...
-
Blackerby Photo reported the following figures on its December 31, 2014, income statement and balance sheet: Compute the asset turnover ratio for2014. Net sales 462,000 Dec. 31, 2014 $ 15,000 54,000...
-
How is the injection velocity calculated for an interplanetary flight to Mars?
-
In 2023, Lisa and Fred, a married couple, have taxable income of $400,000. If they were to file separate tax returns, Lisa would have reported taxable income of $225,000 and Fred would have reported...
-
15. The temperature C, in degrees, that is equivalent to a temperature of F degrees Fahrenheit is given by C- graph of this equation shows the temperature in Celsius for the corresponding...
-
Prepare an Income Statement for the year ending 31 December 2022. Prepare a Balance Sheet as at 31 December 2022. The balance sheet of Torrent and Co at the end of the first of trading is as...
-
a. The traveling salesman problem (TSP) is to find the shortest tour through a given set of n cities that visits each city exactly once before returning to the city where it started. Solve the...
-
John MacLean plans to begin his consulting business as a proprietary company (John Maclean Pty Ltd) on 1 January 2022. He has provided projected data for the first 36 months of operations. John...
-
Find the z-transform for each of the following sequences: (a) 4u(n-4) (b) 2(-0.8)"u(n) (c) 4e-2nu(n) (d) 4(0.8)" cos(0.1n)u(n) (e) e-2(n-3) sin(0.27(n 3))u(n 3)
-
1. It is easy to show that in fcc lattice four basal atoms: (000),(0, , ), (,0, ), (, ,0) form regular tetrahedron with the center at ( , ). It is called the tetrahedral void. The lattice cell...
-
Ligtas Carrier, a common carrier by land, provides the following average gross annual receipts: Transport of passengers P10,000,000Transport of cargoes 6,000,000Sale of goods during travels...
-
Show that gj concave AHUCQ Abadie For nonnegative variables, we have the following corollary.
-
Suppose Carat, Inc., reported net receivables of $2,584 million and $2,265 million at January 31, 2017, and 2016, respectively, after subtracting allowances of $68 million and $65 million at these...
-
Prepare the closing entries from the following selected accounts from the records of Wolf Enterprises at December 31, 2016: How much net income did Wolf Enterprises earn during 2016? Prepare a...
-
Ayers Communications, Inc., is preparing its cash budget for the year ending December 31, 2017. Ayers ended 2016 with cash of $62 million and managers need to keep a cash balance of at least $71...
-
Why is the bar chart not an adequate planning and scheduling tool?
-
Since the bar chart is ineffective as a planning and scheduling tool, why is it still widely used in the construction industry?
-
For the CPM Calculation Exercise found on the companion website, determine the ES, EF, LS, LF, FF, and TF for each activity. Identify the activities through which the critical path runs. How many...
Study smarter with the SolutionInn App