

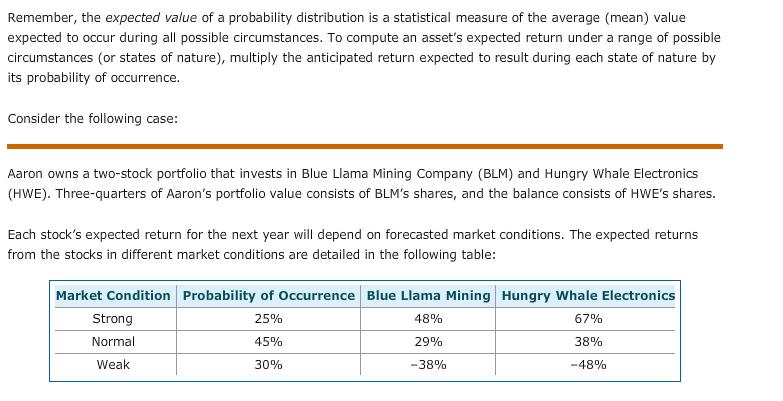
Remember, the expected value of a probability distribution is a statistical measure of the average (mean)...
Fantastic news! We've Found the answer you've been seeking!
Question:
Expert Answer:
Expected return is the weighted average of individual returns Expected return of Blue L... View the full answer

Related Book For 

Posted Date:
