

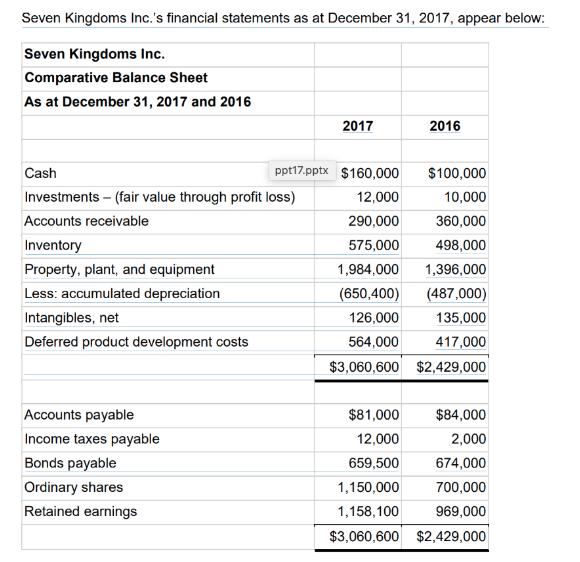
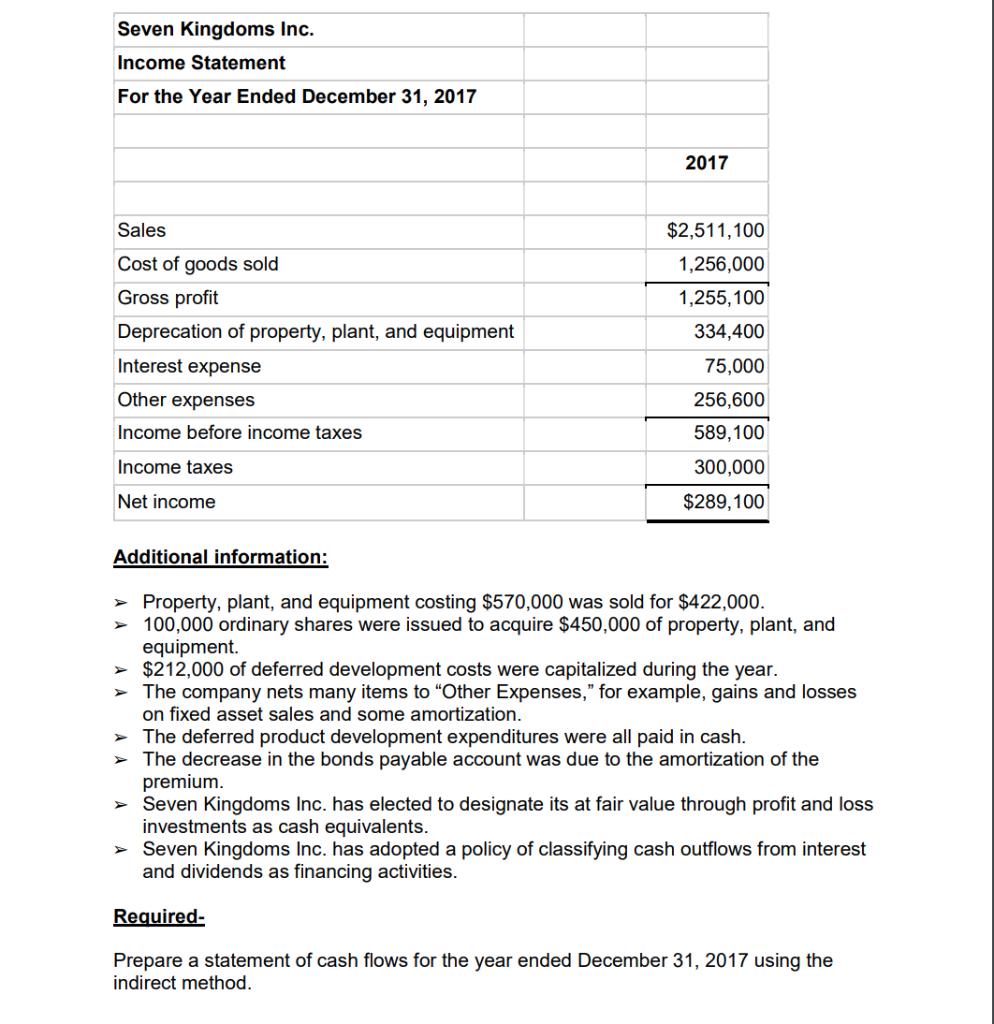
Seven Kingdoms Inc.'s financial statements as at December 31, 2017, appear below: Seven Kingdoms Inc. Comparative...
Fantastic news! We've Found the answer you've been seeking!
Question:
Transcribed Image Text:
Seven Kingdoms Inc.'s financial statements as at December 31, 2017, appear below: Seven Kingdoms Inc. Comparative Balance Sheet As at December 31, 2017 and 2016 Cash Investments - (fair value through profit loss) Accounts receivable Inventory Property, plant, and equipment Less: accumulated depreciation Intangibles, net Deferred product development costs Accounts payable Income taxes payable Bonds payable Ordinary shares Retained earnings 2017 ppt17.pptx $160,000 12,000 290,000 575,000 2016 $100,000 10,000 360,000 498,000 1,984,000 1,396,000 (650,400) (487,000) 126,000 135,000 564,000 417,000 $3,060,600 $2,429,000 $81,000 12,000 659,500 1,150,000 1,158,100 $3,060,600 $2,429,000 $84,000 2,000 674,000 700,000 969,000 Seven Kingdoms Inc. Income Statement For the Year Ended December 31, 2017 Sales Cost of goods sold Gross profit Deprecation of property, plant, and equipment Interest expense Other expenses Income before income taxes Income taxes Net income Additional information: 2017 $2,511,100 1,256,000 1,255,100 334,400 75,000 256,600 589,100 300,000 $289,100 > Property, plant, and equipment costing $570,000 was sold for $422,000. > 100,000 ordinary shares were issued to acquire $450,000 of property, plant, and equipment. > $212,000 of deferred development costs were capitalized during the year. The company nets many items to "Other Expenses," for example, gains and losses on fixed asset sales and some amortization. The deferred product development expenditures were all paid in cash. > The decrease in the bonds payable account was due to the amortization of the premium. > Seven Kingdoms Inc. has elected to designate its at fair value through profit and loss investments as cash equivalents. > Seven Kingdoms Inc. has adopted a policy of classifying cash outflows from interest and dividends as financing activities. Required- Prepare a statement of cash flows for the year ended December 31, 2017 using the indirect method. Seven Kingdoms Inc.'s financial statements as at December 31, 2017, appear below: Seven Kingdoms Inc. Comparative Balance Sheet As at December 31, 2017 and 2016 Cash Investments - (fair value through profit loss) Accounts receivable Inventory Property, plant, and equipment Less: accumulated depreciation Intangibles, net Deferred product development costs Accounts payable Income taxes payable Bonds payable Ordinary shares Retained earnings 2017 ppt17.pptx $160,000 12,000 290,000 575,000 2016 $100,000 10,000 360,000 498,000 1,984,000 1,396,000 (650,400) (487,000) 126,000 135,000 564,000 417,000 $3,060,600 $2,429,000 $81,000 12,000 659,500 1,150,000 1,158,100 $3,060,600 $2,429,000 $84,000 2,000 674,000 700,000 969,000 Seven Kingdoms Inc. Income Statement For the Year Ended December 31, 2017 Sales Cost of goods sold Gross profit Deprecation of property, plant, and equipment Interest expense Other expenses Income before income taxes Income taxes Net income Additional information: 2017 $2,511,100 1,256,000 1,255,100 334,400 75,000 256,600 589,100 300,000 $289,100 > Property, plant, and equipment costing $570,000 was sold for $422,000. > 100,000 ordinary shares were issued to acquire $450,000 of property, plant, and equipment. > $212,000 of deferred development costs were capitalized during the year. The company nets many items to "Other Expenses," for example, gains and losses on fixed asset sales and some amortization. The deferred product development expenditures were all paid in cash. > The decrease in the bonds payable account was due to the amortization of the premium. > Seven Kingdoms Inc. has elected to designate its at fair value through profit and loss investments as cash equivalents. > Seven Kingdoms Inc. has adopted a policy of classifying cash outflows from interest and dividends as financing activities. Required- Prepare a statement of cash flows for the year ended December 31, 2017 using the indirect method. Seven Kingdoms Inc.'s financial statements as at December 31, 2017, appear below: Seven Kingdoms Inc. Comparative Balance Sheet As at December 31, 2017 and 2016 Cash Investments - (fair value through profit loss) Accounts receivable Inventory Property, plant, and equipment Less: accumulated depreciation Intangibles, net Deferred product development costs Accounts payable Income taxes payable Bonds payable Ordinary shares Retained earnings 2017 ppt17.pptx $160,000 12,000 290,000 575,000 2016 $100,000 10,000 360,000 498,000 1,984,000 1,396,000 (650,400) (487,000) 126,000 135,000 564,000 417,000 $3,060,600 $2,429,000 $81,000 12,000 659,500 1,150,000 1,158,100 $3,060,600 $2,429,000 $84,000 2,000 674,000 700,000 969,000 Seven Kingdoms Inc. Income Statement For the Year Ended December 31, 2017 Sales Cost of goods sold Gross profit Deprecation of property, plant, and equipment Interest expense Other expenses Income before income taxes Income taxes Net income Additional information: 2017 $2,511,100 1,256,000 1,255,100 334,400 75,000 256,600 589,100 300,000 $289,100 > Property, plant, and equipment costing $570,000 was sold for $422,000. > 100,000 ordinary shares were issued to acquire $450,000 of property, plant, and equipment. > $212,000 of deferred development costs were capitalized during the year. The company nets many items to "Other Expenses," for example, gains and losses on fixed asset sales and some amortization. The deferred product development expenditures were all paid in cash. > The decrease in the bonds payable account was due to the amortization of the premium. > Seven Kingdoms Inc. has elected to designate its at fair value through profit and loss investments as cash equivalents. > Seven Kingdoms Inc. has adopted a policy of classifying cash outflows from interest and dividends as financing activities. Required- Prepare a statement of cash flows for the year ended December 31, 2017 using the indirect method. Seven Kingdoms Inc.'s financial statements as at December 31, 2017, appear below: Seven Kingdoms Inc. Comparative Balance Sheet As at December 31, 2017 and 2016 Cash Investments - (fair value through profit loss) Accounts receivable Inventory Property, plant, and equipment Less: accumulated depreciation Intangibles, net Deferred product development costs Accounts payable Income taxes payable Bonds payable Ordinary shares Retained earnings 2017 ppt17.pptx $160,000 12,000 290,000 575,000 2016 $100,000 10,000 360,000 498,000 1,984,000 1,396,000 (650,400) (487,000) 126,000 135,000 564,000 417,000 $3,060,600 $2,429,000 $81,000 12,000 659,500 1,150,000 1,158,100 $3,060,600 $2,429,000 $84,000 2,000 674,000 700,000 969,000 Seven Kingdoms Inc. Income Statement For the Year Ended December 31, 2017 Sales Cost of goods sold Gross profit Deprecation of property, plant, and equipment Interest expense Other expenses Income before income taxes Income taxes Net income Additional information: 2017 $2,511,100 1,256,000 1,255,100 334,400 75,000 256,600 589,100 300,000 $289,100 > Property, plant, and equipment costing $570,000 was sold for $422,000. > 100,000 ordinary shares were issued to acquire $450,000 of property, plant, and equipment. > $212,000 of deferred development costs were capitalized during the year. The company nets many items to "Other Expenses," for example, gains and losses on fixed asset sales and some amortization. The deferred product development expenditures were all paid in cash. > The decrease in the bonds payable account was due to the amortization of the premium. > Seven Kingdoms Inc. has elected to designate its at fair value through profit and loss investments as cash equivalents. > Seven Kingdoms Inc. has adopted a policy of classifying cash outflows from interest and dividends as financing activities. Required- Prepare a statement of cash flows for the year ended December 31, 2017 using the indirect method. Seven Kingdoms Inc.'s financial statements as at December 31, 2017, appear below: Seven Kingdoms Inc. Comparative Balance Sheet As at December 31, 2017 and 2016 Cash Investments - (fair value through profit loss) Accounts receivable Inventory Property, plant, and equipment Less: accumulated depreciation Intangibles, net Deferred product development costs Accounts payable Income taxes payable Bonds payable Ordinary shares Retained earnings 2017 ppt17.pptx $160,000 12,000 290,000 575,000 2016 $100,000 10,000 360,000 498,000 1,984,000 1,396,000 (650,400) (487,000) 126,000 135,000 564,000 417,000 $3,060,600 $2,429,000 $81,000 12,000 659,500 1,150,000 1,158,100 $3,060,600 $2,429,000 $84,000 2,000 674,000 700,000 969,000 Seven Kingdoms Inc. Income Statement For the Year Ended December 31, 2017 Sales Cost of goods sold Gross profit Deprecation of property, plant, and equipment Interest expense Other expenses Income before income taxes Income taxes Net income Additional information: 2017 $2,511,100 1,256,000 1,255,100 334,400 75,000 256,600 589,100 300,000 $289,100 > Property, plant, and equipment costing $570,000 was sold for $422,000. > 100,000 ordinary shares were issued to acquire $450,000 of property, plant, and equipment. > $212,000 of deferred development costs were capitalized during the year. The company nets many items to "Other Expenses," for example, gains and losses on fixed asset sales and some amortization. The deferred product development expenditures were all paid in cash. > The decrease in the bonds payable account was due to the amortization of the premium. > Seven Kingdoms Inc. has elected to designate its at fair value through profit and loss investments as cash equivalents. > Seven Kingdoms Inc. has adopted a policy of classifying cash outflows from interest and dividends as financing activities. Required- Prepare a statement of cash flows for the year ended December 31, 2017 using the indirect method. Seven Kingdoms Inc.'s financial statements as at December 31, 2017, appear below: Seven Kingdoms Inc. Comparative Balance Sheet As at December 31, 2017 and 2016 Cash Investments - (fair value through profit loss) Accounts receivable Inventory Property, plant, and equipment Less: accumulated depreciation Intangibles, net Deferred product development costs Accounts payable Income taxes payable Bonds payable Ordinary shares Retained earnings 2017 ppt17.pptx $160,000 12,000 290,000 575,000 2016 $100,000 10,000 360,000 498,000 1,984,000 1,396,000 (650,400) (487,000) 126,000 135,000 564,000 417,000 $3,060,600 $2,429,000 $81,000 12,000 659,500 1,150,000 1,158,100 $3,060,600 $2,429,000 $84,000 2,000 674,000 700,000 969,000 Seven Kingdoms Inc. Income Statement For the Year Ended December 31, 2017 Sales Cost of goods sold Gross profit Deprecation of property, plant, and equipment Interest expense Other expenses Income before income taxes Income taxes Net income Additional information: 2017 $2,511,100 1,256,000 1,255,100 334,400 75,000 256,600 589,100 300,000 $289,100 > Property, plant, and equipment costing $570,000 was sold for $422,000. > 100,000 ordinary shares were issued to acquire $450,000 of property, plant, and equipment. > $212,000 of deferred development costs were capitalized during the year. The company nets many items to "Other Expenses," for example, gains and losses on fixed asset sales and some amortization. The deferred product development expenditures were all paid in cash. > The decrease in the bonds payable account was due to the amortization of the premium. > Seven Kingdoms Inc. has elected to designate its at fair value through profit and loss investments as cash equivalents. > Seven Kingdoms Inc. has adopted a policy of classifying cash outflows from interest and dividends as financing activities. Required- Prepare a statement of cash flows for the year ended December 31, 2017 using the indirect method. Seven Kingdoms Inc.'s financial statements as at December 31, 2017, appear below: Seven Kingdoms Inc. Comparative Balance Sheet As at December 31, 2017 and 2016 Cash Investments - (fair value through profit loss) Accounts receivable Inventory Property, plant, and equipment Less: accumulated depreciation Intangibles, net Deferred product development costs Accounts payable Income taxes payable Bonds payable Ordinary shares Retained earnings 2017 ppt17.pptx $160,000 12,000 290,000 575,000 2016 $100,000 10,000 360,000 498,000 1,984,000 1,396,000 (650,400) (487,000) 126,000 135,000 564,000 417,000 $3,060,600 $2,429,000 $81,000 12,000 659,500 1,150,000 1,158,100 $3,060,600 $2,429,000 $84,000 2,000 674,000 700,000 969,000 Seven Kingdoms Inc. Income Statement For the Year Ended December 31, 2017 Sales Cost of goods sold Gross profit Deprecation of property, plant, and equipment Interest expense Other expenses Income before income taxes Income taxes Net income Additional information: 2017 $2,511,100 1,256,000 1,255,100 334,400 75,000 256,600 589,100 300,000 $289,100 > Property, plant, and equipment costing $570,000 was sold for $422,000. > 100,000 ordinary shares were issued to acquire $450,000 of property, plant, and equipment. > $212,000 of deferred development costs were capitalized during the year. The company nets many items to "Other Expenses," for example, gains and losses on fixed asset sales and some amortization. The deferred product development expenditures were all paid in cash. > The decrease in the bonds payable account was due to the amortization of the premium. > Seven Kingdoms Inc. has elected to designate its at fair value through profit and loss investments as cash equivalents. > Seven Kingdoms Inc. has adopted a policy of classifying cash outflows from interest and dividends as financing activities. Required- Prepare a statement of cash flows for the year ended December 31, 2017 using the indirect method. Seven Kingdoms Inc.'s financial statements as at December 31, 2017, appear below: Seven Kingdoms Inc. Comparative Balance Sheet As at December 31, 2017 and 2016 Cash Investments - (fair value through profit loss) Accounts receivable Inventory Property, plant, and equipment Less: accumulated depreciation Intangibles, net Deferred product development costs Accounts payable Income taxes payable Bonds payable Ordinary shares Retained earnings 2017 ppt17.pptx $160,000 12,000 290,000 575,000 2016 $100,000 10,000 360,000 498,000 1,984,000 1,396,000 (650,400) (487,000) 126,000 135,000 564,000 417,000 $3,060,600 $2,429,000 $81,000 12,000 659,500 1,150,000 1,158,100 $3,060,600 $2,429,000 $84,000 2,000 674,000 700,000 969,000 Seven Kingdoms Inc. Income Statement For the Year Ended December 31, 2017 Sales Cost of goods sold Gross profit Deprecation of property, plant, and equipment Interest expense Other expenses Income before income taxes Income taxes Net income Additional information: 2017 $2,511,100 1,256,000 1,255,100 334,400 75,000 256,600 589,100 300,000 $289,100 > Property, plant, and equipment costing $570,000 was sold for $422,000. > 100,000 ordinary shares were issued to acquire $450,000 of property, plant, and equipment. > $212,000 of deferred development costs were capitalized during the year. The company nets many items to "Other Expenses," for example, gains and losses on fixed asset sales and some amortization. The deferred product development expenditures were all paid in cash. > The decrease in the bonds payable account was due to the amortization of the premium. > Seven Kingdoms Inc. has elected to designate its at fair value through profit and loss investments as cash equivalents. > Seven Kingdoms Inc. has adopted a policy of classifying cash outflows from interest and dividends as financing activities. Required- Prepare a statement of cash flows for the year ended December 31, 2017 using the indirect method.
Expert Answer:
Answer rating: 100% (QA)
Cash flow statement For the year ended 31 December 2017 Cash flow from operating activities Net income 289100 Adjustments to reconcile net income to n... View the full answer

Related Book For 
Posted Date:
Students also viewed these accounting questions
-
Ortega Corporation's income statement for the year ended June 30, 2011, and its comparative balance sheets as of June 30, 2011 and 2010, appear on the nest page. During 2011, the corporation sod at a...
-
Bronek Corporations income statement for the year ended June 30, 2011, and its comparative balance sheets as of June 30, 2011 and 2010 follow. During 2011, the corporation sold at a loss of $2,000...
-
Reed Corporations income statement for the year ended June 30, 2014, and its comparative balance sheets as of June 30, 2014 and 2013, follow. During 2014, the corporation sold at a loss of $8,000...
-
Once down to about 15, the worlds only wild flock of whooping cranes now numbers a record 237 birds in its Texas Coastal Bend wintering ground (www.SunHerald.com). The average whooping crane egg...
-
Determine the missing amounts in each of these four separate situations a throughd. Supplies available-prior year-end . . . . . . .. . Supplies purchased during the current year $ 400 $1,200$1,260 ?...
-
Integrate the equation dx / dt = -gt + gt0 + v0 in the paragraph after Eq. (1.11) to find x as a function of time. Use the condition that the particle was at x0 at time t0 to evaluate the integration...
-
Reactions of stakeholders who do not feel that accounting provides serviceable information include: resignation and loyalty; voice; and exit. 1 Why are exit and voice of particular importance as...
-
According to the U.S. Bureau of Labor Statistics, the average weekly earnings of a production worker in 1997 were $424.20. Suppose a labor researcher wants to test to determine whether this figure is...
-
Cost of goods sold, inventory, and purchases budget Quinn Company sells mobile phones worldwide. The company begins January with $235,800 of inventory. It expects to sell 4,600 mobile phones for $160...
-
Reynolds Printing Company specializes in wedding announcements. Reynolds uses an actual job-order costing system. An actual overhead rate is calculated at the end of each month using actual direct...
-
A bag contains a red ball, a blue ball and a yellow ball, all the balls being of the same size. Kritika takes out a ball from the bag without looking into it. What is the probability that she takes...
-
The element mass matrix in the global coordinate system, \([\bar{m}]\), can be expressed in terms of the element mass matrix in local coordinate system \([\mathrm{m}]\) and the coordinate...
-
True or False. The force transmitted to the foundation of an isolator with rigid foundation can never be infinity.
-
Fill in the Blank. Although an undamped vibration absorber removes the original resonance peak of the response, it introduces ____________ new peaks.
-
Does spring mounting always reduce the vibration of the foundation of a machine?
-
True or False. The transmissibility is also called the transmission ratio.
-
In a location where there is no hydrostatic pressure what is required to be installed on a foundation wall where the exterior finished ground level is higher than the floor level inside the building?
-
Kenneth Hubbard has prepared the following list of statements about managerial accounting and financial accounting. 1. Financial accounting focuses on providing information to internal users. 2....
-
On January 1, 2019, Dudas Inc. entered into a 12-month, non-renewable lease to rent office equipment. The lease payment is $1,500 per month first due on January 31, 2019. The interest rate implicit...
-
Sherbrook Pizza Inc. (SPI) was incorporated on January 1, 2018. Its capital structure included 5,000 ordinary shares; 1,000, $100, 4%, non-cumulative preferred shares; and 10,000 options on ordinary...
-
The following are selected details of Complex Capital Structures Inc.s capital structure as at January 1, 2018: 400,000 ordinary shares were issued; 200,000 were outstanding. Bonds A$2,000,000, 4%,...
-
Which of the following is the reason preliminary estimates of materiality should be made by the auditor? a. Materiality guidelines cannot be adjusted after the audit procedures are conducted. b....
-
Which of the following is not a part of the audit risk model? a. Inherent risk. b. Control risk. c. Materiality risk. d. Detection risk.
-
Which of the following is a correct statement? a. There is an inverse relationship between risk levels and the amount of necessary audit effort. b. There is a direct relationship between risk levels...

Study smarter with the SolutionInn App