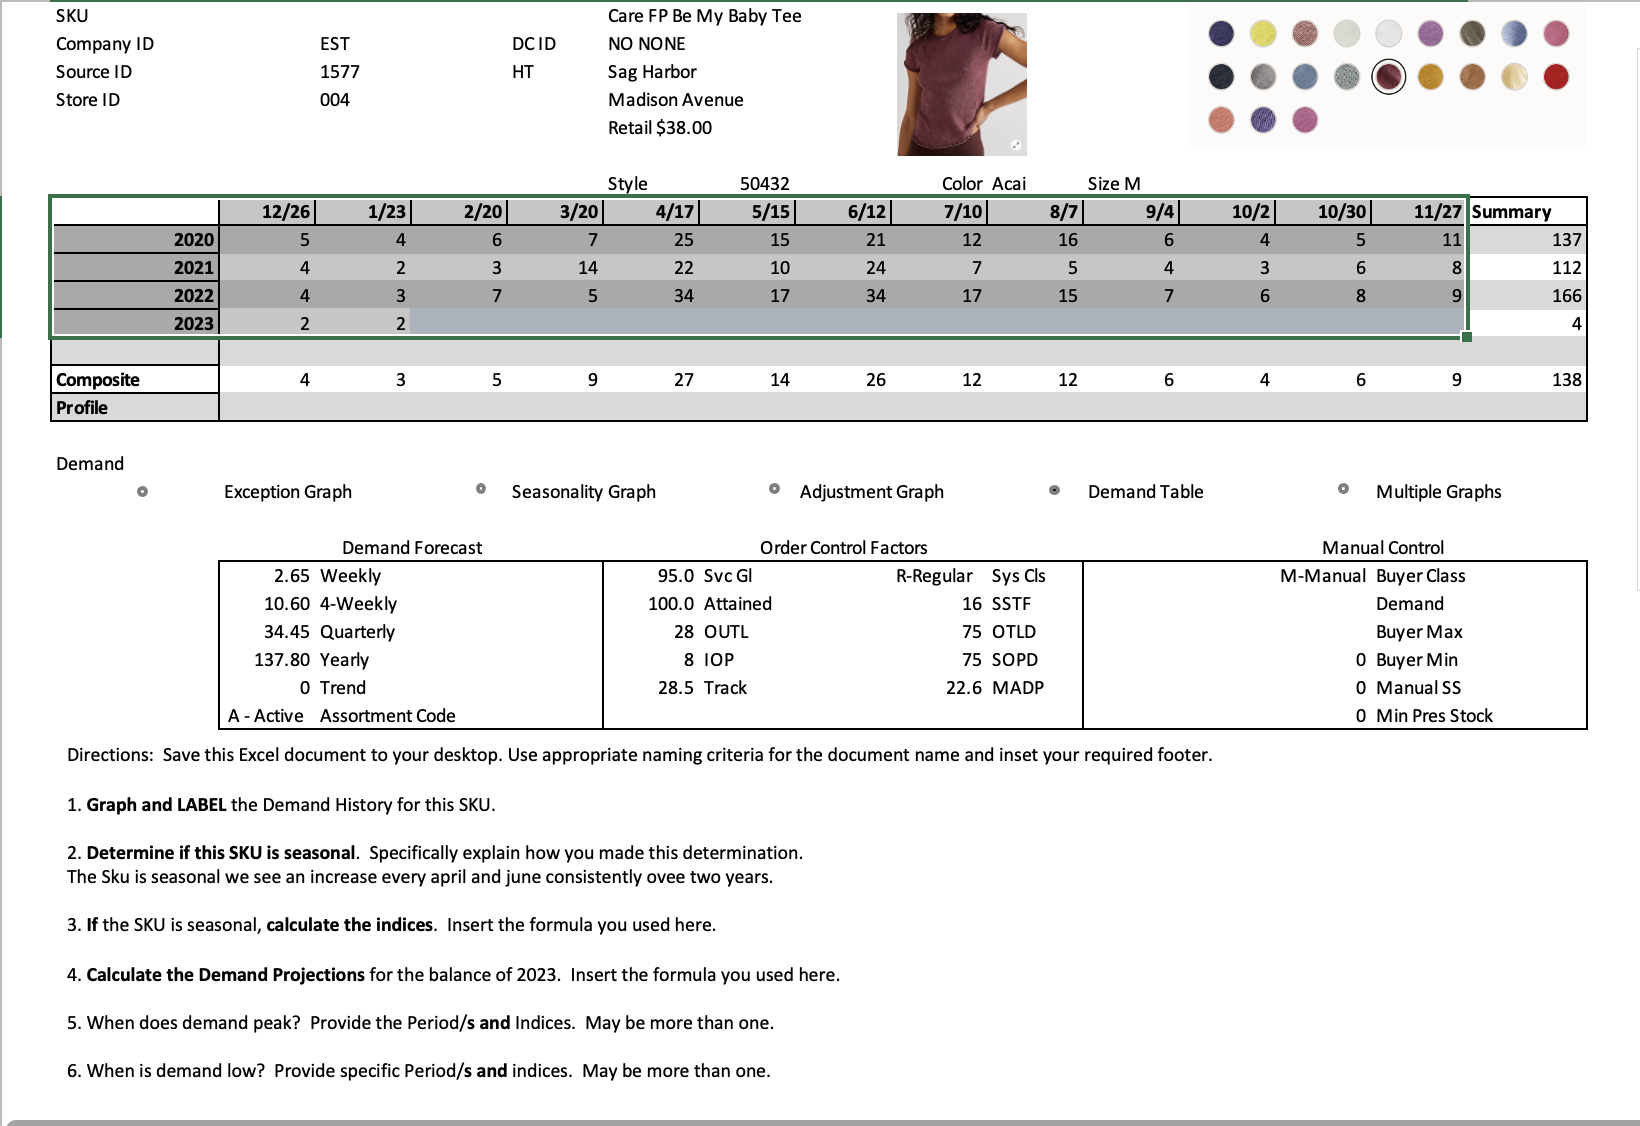
SKU Company ID Source ID Store ID Composite Profile Demand 2020 2021 2022 2023 12/26 5...
Fantastic news! We've Found the answer you've been seeking!
Question:
Transcribed Image Text:
SKU Company ID Source ID Store ID Composite Profile Demand 2020 2021 2022 2023 12/26 5 4 4 2 4 EST 1577 004 Exception Graph 1/23 4 2 3 2 3 2/20 6 3 7 O Demand Forecast 5 DC ID HT 3/20 7 14 5 9 Care FP Be My Baby Tee NO NONE Sag Harbor Madison Avenue Retail $38.00 Style 4/17 25 22 34 Seasonality Graph 27 50432 5/15 15 10 17 14 28 OUTL 8 IOP 28.5 Track 6/12 21 24 34 95.0 Svc GI 100.0 Attained 26 Order Control Factors Color Acai 7/10 12 Adjustment Graph 7 17 12 8/7 16 R-Regular Sys Cls 16 SSTF 75 OTLD 75 SOPD 22.6 MADP 5 15 12 Size M 9/4 6 4 7 2.65 Weekly 10.60 4-Weekly 34.45 Quarterly 137.80 Yearly 0 Trend A- Active Assortment Code Directions: Save this Excel document to your desktop. Use appropriate naming criteria for the document name and inset your required footer. 1. Graph and LABEL the Demand History for this SKU. 2. Determine if this SKU is seasonal. Specifically explain how you made this determination. The Sku is seasonal we see an increase every april and june consistently ovee two years. 3. If the SKU is seasonal, calculate the indices. Insert the formula you used here. 4. Calculate the Demand Projections for the balance of 2023. Insert the formula you used here. 5. When does demand peak? Provide the Period/s and Indices. May be more than one. 6. When is demand low? Provide specific Period/s and indices. May be more than one. 6 Demand Table 10/2 4 3 6 4 10/30 5 6 8 6 11/27 Summary 11 8 9 9 O Multiple Graphs Manual Control M-Manual Buyer Class Demand Buyer Max 0 Buyer Min 0 Manual SS 0 Min Pres Stock 137 112 166 4 138 SKU Company ID Source ID Store ID Composite Profile Demand 2020 2021 2022 2023 12/26 5 4 4 2 4 EST 1577 004 Exception Graph 1/23 4 2 3 2 3 2/20 6 3 7 O Demand Forecast 5 DC ID HT 3/20 7 14 5 9 Care FP Be My Baby Tee NO NONE Sag Harbor Madison Avenue Retail $38.00 Style 4/17 25 22 34 Seasonality Graph 27 50432 5/15 15 10 17 14 28 OUTL 8 IOP 28.5 Track 6/12 21 24 34 95.0 Svc GI 100.0 Attained 26 Order Control Factors Color Acai 7/10 12 Adjustment Graph 7 17 12 8/7 16 R-Regular Sys Cls 16 SSTF 75 OTLD 75 SOPD 22.6 MADP 5 15 12 Size M 9/4 6 4 7 2.65 Weekly 10.60 4-Weekly 34.45 Quarterly 137.80 Yearly 0 Trend A- Active Assortment Code Directions: Save this Excel document to your desktop. Use appropriate naming criteria for the document name and inset your required footer. 1. Graph and LABEL the Demand History for this SKU. 2. Determine if this SKU is seasonal. Specifically explain how you made this determination. The Sku is seasonal we see an increase every april and june consistently ovee two years. 3. If the SKU is seasonal, calculate the indices. Insert the formula you used here. 4. Calculate the Demand Projections for the balance of 2023. Insert the formula you used here. 5. When does demand peak? Provide the Period/s and Indices. May be more than one. 6. When is demand low? Provide specific Period/s and indices. May be more than one. 6 Demand Table 10/2 4 3 6 4 10/30 5 6 8 6 11/27 Summary 11 8 9 9 O Multiple Graphs Manual Control M-Manual Buyer Class Demand Buyer Max 0 Buyer Min 0 Manual SS 0 Min Pres Stock 137 112 166 4 138
Expert Answer:
Answer rating: 100% (QA)
It looks like youve shared an image with instructions for analyzing SKU Stock Keeping Unit sales data from a company and performing various tasks such ... View the full answer
Related Book For
Income Tax Fundamentals 2013
ISBN: 9781285586618
31st Edition
Authors: Gerald E. Whittenburg, Martha Altus Buller, Steven L Gill
Posted Date:
Students also viewed these general management questions
-
The following additional information is available for the Dr. Ivan and Irene Incisor family from Chapters 1-5. Ivan's grandfather died and left a portfolio of municipal bonds. In 2012, they pay Ivan...
-
Two basic assumptions of technical analysis are that security prices adjust: A. rapidly to new information and market prices are determined by the interaction of supply and demand. B. rapidly to new...
-
Two people each pull with a force of 300 N on a rope in a tug-of-war. What is the net force on the rope? How much force is exerted on each person by the rope?
-
Which of the IIA Standards provide specific guidance to internal auditors regarding their fraud-related responsibilities?
-
A home supplies company decides to produce a reusable moisture absorber product for removing the water content in air in an enclosed space. A reduction in humidity is expected to help inhibit the...
-
Sophisticates, Inc., a distributor of jewelry throughout California, is in the process of assembling a cash budget for the first quarter of 20x1. The following information has been extracted from the...
-
Solve the equation: m +3 = m + 12
-
a. Prepare a UML class diagram that captures Rubber Duck's brewing process. b. Using the preceding information and the following attributes list, prepare a listing of the relational tables,...
-
Three point charges, 91 = -3.88nC, q2 = 5.41nC and 93 = 3.43nC are aligned along the x axis as shown in the figure below. Assume that L = 0.490m and L2 = 0.767m. 91 L 92 L2 Calculate the electric...
-
Professional email Thanks for the feedback, there seems to be a discrepancy in the headings for direct cost and operating cost. It appears that these may have been mistakenly swapped. I would...
-
You are considering buying an oven for your bakery. The oven allows you to "bake fresh cakes to order." However, baking in the store is more expensive than receiving from suppliers, and you estimate...
-
One of the stores of the Grocery Sales Organization (GSO) has asked for your help to try to figure out if they should hire more cashiers for the upcoming months or if they will have enough to meet...
-
1. According to the case, which BlackBerry division seemed to have "potential"? BlackBerry Division Research and Development Division Security Enterprise Division All of the answers are correct. None...
-
The article true north. As you read this article, have you found your true north? What does this mean to you as a leader in the healthcare sector? what else do we know about the attributes of the...
-
Consider the following constant elasticity of substitution function Q = 75 [0.3K04+ (1-0.3) L-0.41% Which is to be maximized subject to the constrain +K+ 3L = 120 Determine the optimal number of...
-
1. What is the semi-annually compounded interest rate if $200 accumulates to $318.77 in eight years? Answer in percentage with two decimal places. 2. What is the quarterly compounded interest rate if...
-
Carl and Jenny adopt a Russian orphan. The adoption takes 2 years and two trips to Russia and is final in 2012. They pay $6,000 in 2011 and $7,500 in 2012 of qualified adoption expenses, and have AGI...
-
Larry Gaines, age 42, sells his personal residence on November 12, 2012, for $144,000. He lived in the house for 7 years. The expenses of the sale are $10,500, and he has made capital improvements of...
-
Phil and Linda are 25-year-old newlyweds and file a joint tax return. Linda is covered by a retirement plan at work, but Phil is not. a. Assuming Phil's wages were $27,000 and Linda's wages were...
-
The number on the jersey of each New York Giants football player is recorded, then the mean of those numbers is computed. Decide whether the statement makes sense (or is clearly true) or does not...
-
A professor calculates final grades using a weighted mean in which the final exam counts twice as much as the midterm. Decide whether the statement makes sense (or is clearly true) or does not make...
-
The following ages (years) of survey respondents: 22, 19, 21, 27, over 65, over 80. State whether the mean or median would give a better description of the average. Explain your reasoning.
Study smarter with the SolutionInn App