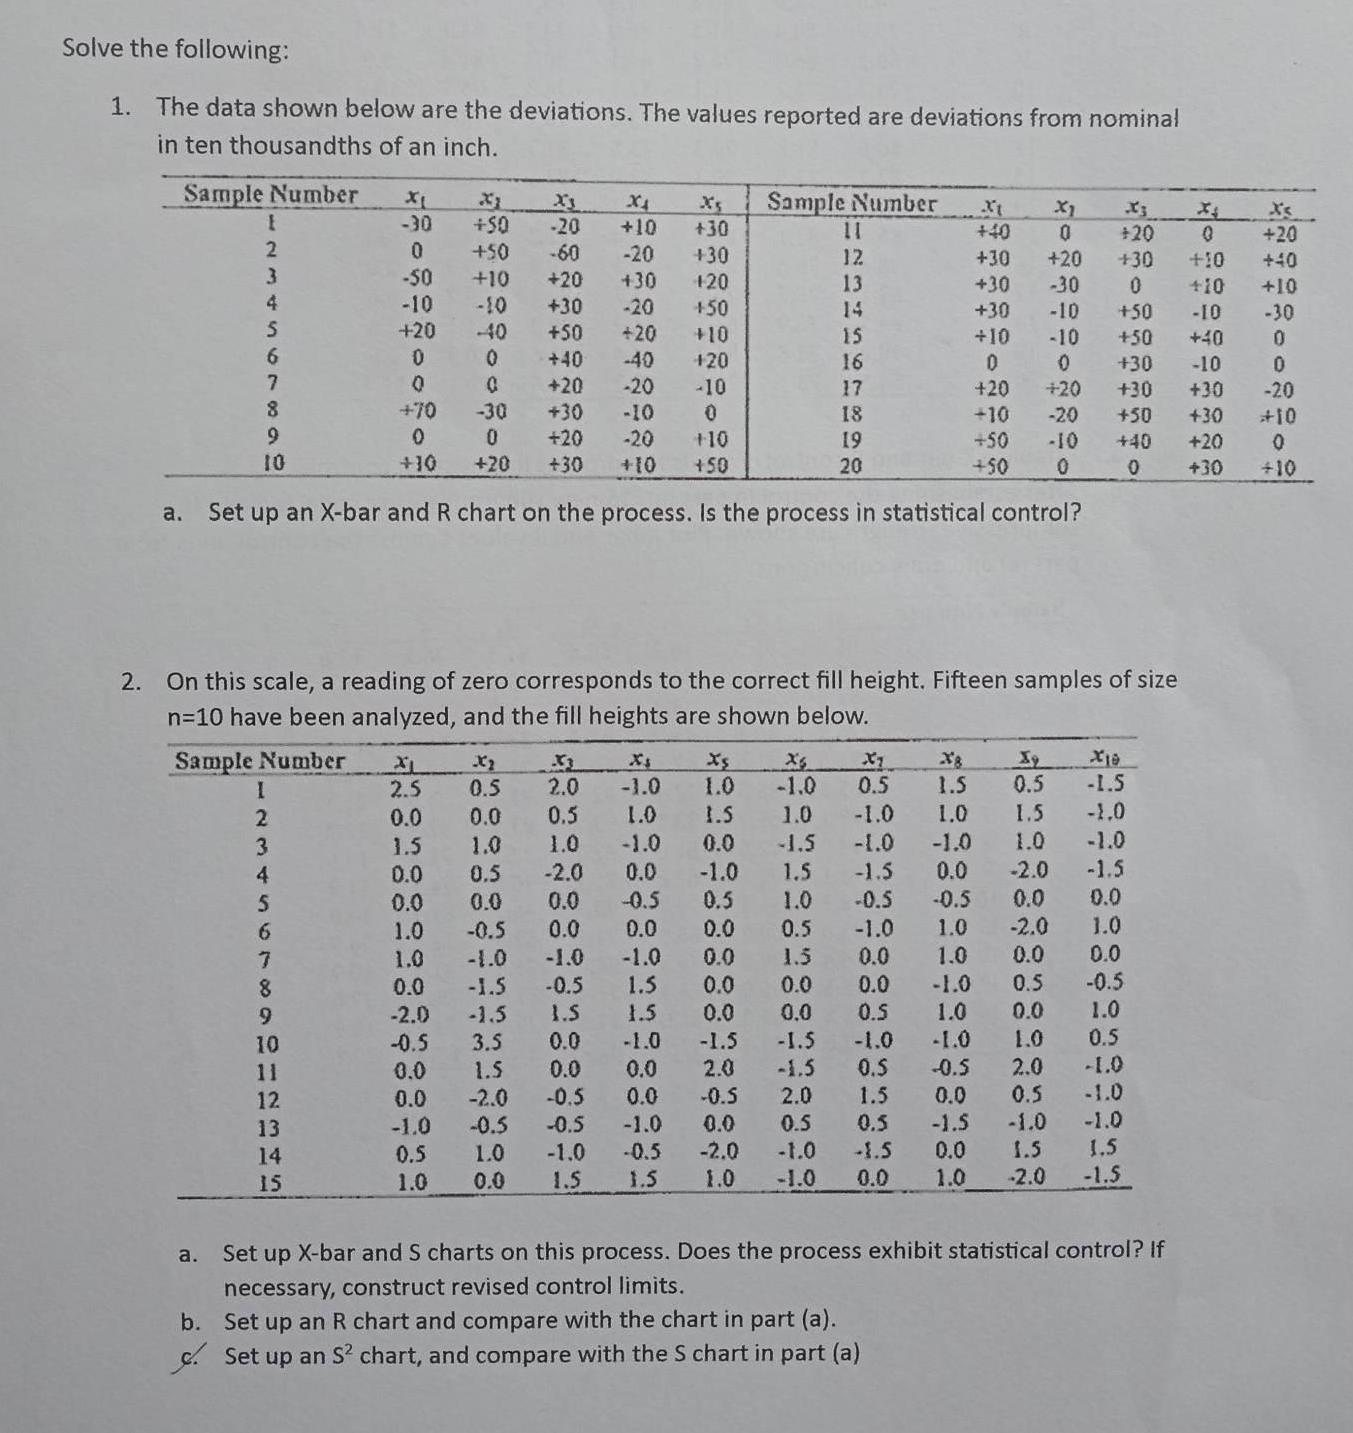
Solve the following: 1. The data shown below are the deviations. The values reported are deviations...
Fantastic news! We've Found the answer you've been seeking!
Question:
Transcribed Image Text:
Solve the following: 1. The data shown below are the deviations. The values reported are deviations from nominal in ten thousandths of an inch. Sample Number XI -30 +50 -20 0 +50 -60 -20 -50 +10 +20 +30 -10 -10 +30 -20 +50 +20 -40 +50 +20 +10 0 0 +40 -40 +20 0 0 +20 -20 -10 +70 -30 +30 -10 0 0 +10 0 +20 -20 +10 +20 +30 +10 +50 a. Set up an X-bar and R chart on the process. Is the process in statistical control? I 2 3 4 5 6 7 8 9 10 I 2 3 4 5 6 7 8 9 10 11 12 13 14 15 X₁ 2.5 0.0 1.5 0.0 1.0 1.0 X₁ +10 1.0 -2.0 Sample Number 11 12 +30 +30 +20 X₂ Xs 0.5 33 2.0 -1.0 1.0 -1.0 0.0 0.5 1.0 1.5 1.0 1.0 0.5 0.0 0.0 -0.5 -0.5 0.0 0.0 -1.0 -1.0 -1.0 0.0 -1.5 -0.5 1.5 -2.0 -1.5 1.S 1.5 -0.5 3.5 0.0 -1.0 0.0 1.5 0.0 0.0 0.0 -2.0 -0.5 0.0 -1.0 -0.5 -0.5 -1.0 0.5 1.0 1.0 0.0 -1.0 1.5 13 14 15 16 17 18 19 20 2. On this scale, a reading of zero corresponds to the correct fill height. Fifteen samples of size n=10 have been analyzed, and the fill heights are shown below. Sample Number X1 0 +20 +30 -30 +30 -10 +10 -10 0 0 420 +20 +10 -20 +50 -10 +50 0 +40 +30 +20 +30 0 +50 +50 +30 +30 +30 X10 -1.5 -1.0 -1.0 -1.5 X1 0.5 1.5 0.5 -1.0 1.0 1.5 -1.0 -1.0 1.0 -1.0 0.0 -1.5 0.0 -1.0 1.5 -1.5 0.0 -2.0 0.5 1.0 -0.5 -0.5 0.0 0.0 0.5 -1.0 1.0 -2.0 1.0 0.0 1.5 0.0 1.0 0.0 0.0 0.0 0.0 0.0 -1.0 0.5 -0.5 0.0 0.0 0.5 1.0 0.0 1.0 -1.5 -1.5 -1.0 -1.0 1.0 2.0 -1.5 0.5 -0.5 2.0 -0.5 2.0 0.0 0.5 0.0 1.5 0.5 0.5 -1.0 -1.5 -1.5 -1.0 -0.5 -2.0 0.0 1.5 1.5 1.0 -1.0 0.0 1.0 -2.0 +50 +30 +40 +20 0 +30 0 +10 +10 -10 0.5 -1.0 -1.0 -1.0 1.5 -1.5 a. Set up X-bar and S charts on this process. Does the process exhibit statistical control? If necessary, construct revised control limits. b. Set up an R chart and compare with the chart in part (a). Set up an S² chart, and compare with the S chart in part (a) +40 -10 X's +20 +40 +10 -30 0 0 -20 +10 0 +10 Solve the following: 1. The data shown below are the deviations. The values reported are deviations from nominal in ten thousandths of an inch. Sample Number XI -30 +50 -20 0 +50 -60 -20 -50 +10 +20 +30 -10 -10 +30 -20 +50 +20 -40 +50 +20 +10 0 0 +40 -40 +20 0 0 +20 -20 -10 +70 -30 +30 -10 0 0 +10 0 +20 -20 +10 +20 +30 +10 +50 a. Set up an X-bar and R chart on the process. Is the process in statistical control? I 2 3 4 5 6 7 8 9 10 I 2 3 4 5 6 7 8 9 10 11 12 13 14 15 X₁ 2.5 0.0 1.5 0.0 1.0 1.0 X₁ +10 1.0 -2.0 Sample Number 11 12 +30 +30 +20 X₂ Xs 0.5 33 2.0 -1.0 1.0 -1.0 0.0 0.5 1.0 1.5 1.0 1.0 0.5 0.0 0.0 -0.5 -0.5 0.0 0.0 -1.0 -1.0 -1.0 0.0 -1.5 -0.5 1.5 -2.0 -1.5 1.S 1.5 -0.5 3.5 0.0 -1.0 0.0 1.5 0.0 0.0 0.0 -2.0 -0.5 0.0 -1.0 -0.5 -0.5 -1.0 0.5 1.0 1.0 0.0 -1.0 1.5 13 14 15 16 17 18 19 20 2. On this scale, a reading of zero corresponds to the correct fill height. Fifteen samples of size n=10 have been analyzed, and the fill heights are shown below. Sample Number X1 0 +20 +30 -30 +30 -10 +10 -10 0 0 420 +20 +10 -20 +50 -10 +50 0 +40 +30 +20 +30 0 +50 +50 +30 +30 +30 X10 -1.5 -1.0 -1.0 -1.5 X1 0.5 1.5 0.5 -1.0 1.0 1.5 -1.0 -1.0 1.0 -1.0 0.0 -1.5 0.0 -1.0 1.5 -1.5 0.0 -2.0 0.5 1.0 -0.5 -0.5 0.0 0.0 0.5 -1.0 1.0 -2.0 1.0 0.0 1.5 0.0 1.0 0.0 0.0 0.0 0.0 0.0 -1.0 0.5 -0.5 0.0 0.0 0.5 1.0 0.0 1.0 -1.5 -1.5 -1.0 -1.0 1.0 2.0 -1.5 0.5 -0.5 2.0 -0.5 2.0 0.0 0.5 0.0 1.5 0.5 0.5 -1.0 -1.5 -1.5 -1.0 -0.5 -2.0 0.0 1.5 1.5 1.0 -1.0 0.0 1.0 -2.0 +50 +30 +40 +20 0 +30 0 +10 +10 -10 0.5 -1.0 -1.0 -1.0 1.5 -1.5 a. Set up X-bar and S charts on this process. Does the process exhibit statistical control? If necessary, construct revised control limits. b. Set up an R chart and compare with the chart in part (a). Set up an S² chart, and compare with the S chart in part (a) +40 -10 X's +20 +40 +10 -30 0 0 -20 +10 0 +10
Expert Answer:
Answer rating: 100% (QA)
To set up an Xbar and R chart on the process we need to calculate the sample means and ranges a Xbar ... View the full answer
Related Book For
Introduction to Statistical Quality Control
ISBN: 978-1118146811
7th edition
Authors: Douglas C Montgomery
Posted Date:
Students also viewed these mathematics questions
-
If the focal length of a lens is 3 centimeters and the image distance is 5 centimeters from the lens, what is the distance from the object to the lens?
-
The raw data for Problem 22, from Freund (1979), appear below. For the model of Problem 22, a. Fit the model. b. What discrepancies do you note between the results of (a) and the data summary...
-
A survey of information systems managers was used to predict the yearly salary of beginning programmer/analysts in a metropolitan area. Managers specified their standard salary for a beginning...
-
A tape player has three operations: play, fast forward and fast play. Play and fast forward are activated using the play and fast forward button respectively. These operations can be cancelled using...
-
An investigation was conducted to determine the source of reduction in yield of a certain chemical product. It was known that the loss in yield occurred in the mother liquor, that is. The material...
-
What is strategic analysis? Discuss the types of knowledge that auditors strive to obtain from the analysis.
-
Using the steps outlined in the five-step transaction analysis, record the following transactions in the general journal for Laverden Plumbing, Inc. Explanations are not required. May 1 5 Paid...
-
Sandy Edge is president of Edge File Works, a firm that manufactures two types of metal file cabinets. The demand for the two-drawer model is 650 cabinets per week; demand for the three- drawer...
-
Problem 13-7 (Algo) Prepare a Statement of Cash Flows [LO13-1, LO13-2] [The following information applies to the questions displayed below.] Comparative financial statements for Weaver Company...
-
The July transactions of Acorn Industries are described in Problem 7-2B. Problem 7-2B, Acorn Industries completes these transactions during July of the current year (the terms of all its credit sales...
-
Consider the AMD Opteron virtual memory system, the page tables for which are depicted below. Note that the architecture supports 64 bit virtual addresses but in most implementations so far the most...
-
Update Knowledge of the Events Industry. ASSESSMENT INSTRUCTIONS While being observed by your assessor, you are to use information identified and opportunities to update knowledge of the events...
-
C. Write C++ code for a while loop that reads positive integers and computes their sum. It stops when the sum reaches the value of 50 or more. Once the loop stops, the number of integers read will be...
-
A woman is standing at a railroad crossing for a track that runs east and west. As she faces the track, east is to her right and west is to her left. Two trains on the track some distance apart are...
-
how do you download the program? name = input('What is your name? ') age = int(input('How old are you? ')) from datetime import datetime current_year = datetime.now().year birth_year = current_year -...
-
Melissa Jones is nurse manager of a 40-bed, long-term care unit that is essentially a small nursing home contained within Community Hospital. The unit is almost always fully occupied. A number of the...
-
The management at Prospect Company is trying to increase its net income for the current year. Which of the following could Prospect do before the end of the year to increase its net income? Try to...
-
Suppose that A is an m n matrix with linearly independent columns and the linear system LS(A, b) is consistent. Show that this system has a unique solution.
-
Use the data in Table 10E.1 to set up short-run charts using the DNOM approach. The nominal and x R dimensions for each part are TA = 100, TB = 60, TC = 75, and TD = 50. TABLE 10E.1 Data for Exercise...
-
A process is in control with x = 100.s = 1.05, and n = 5. The process specifications are at 95 ± 10. The quality characteristic has a normal distribution. (a) Estimate the potential...
-
Reconsider the loan application data in Table 7E.2. Set up the fraction nonconforming control chart for this process. Use the average sample size control limit approach. Plot the preliminary data in...
-
Refer to Exercise 5. Four of the eight students are from Middle Georgia State University. What is the probability that all three of the interviewed students are from Middle Georgia State University?
-
The law of large numbers states that as a probability experiment is repeated, the proportion of times that a given outcome occurs will approach its probability. In Exercises 912, determine whether...
-
The following table presents numbers of U.S. workers, in thousands, categorized by type of occupation and educational level. a. What is the probability that a randomly selected worker is a college...
Study smarter with the SolutionInn App