

SPSS Project #2 The goal of this second SPSS project is to learn how to run...
Fantastic news! We've Found the answer you've been seeking!
Question:
Transcribed Image Text:
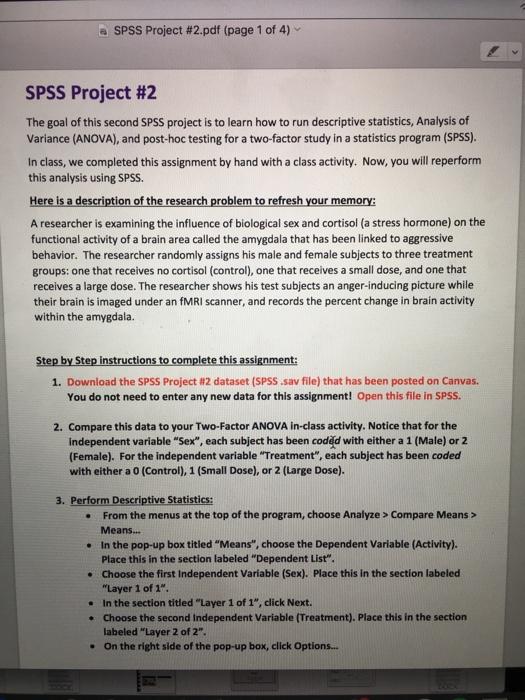
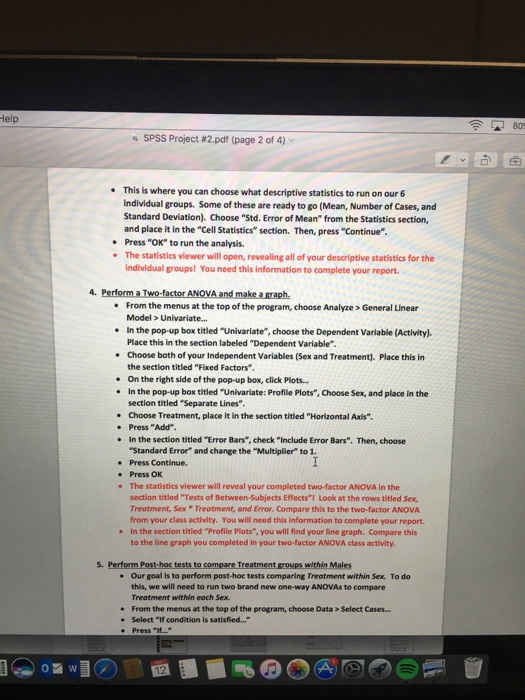
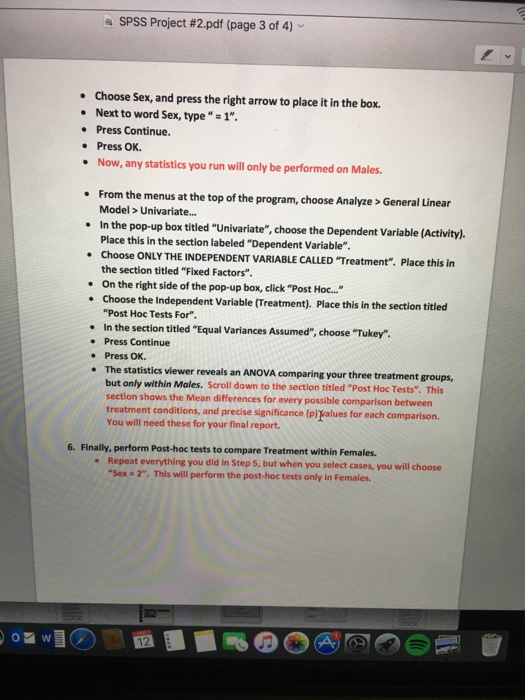
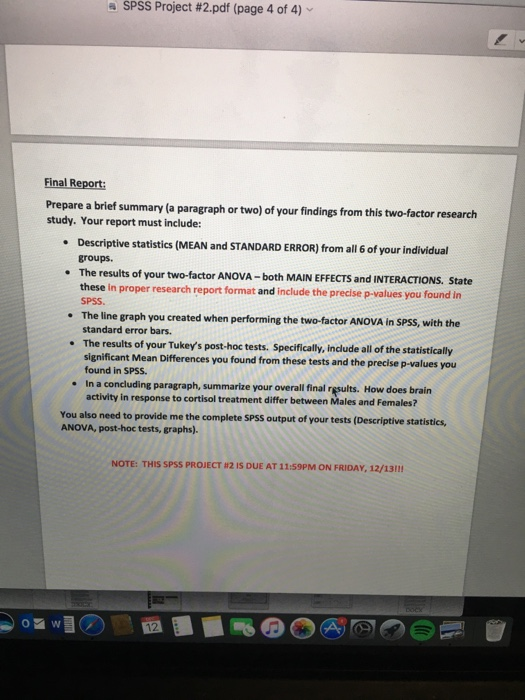
SPSS Project #2 The goal of this second SPSS project is to learn how to run descriptive statistics, Analysis of Variance (ANOVA), and post-hoc testing for a two-factor study in a statistics program (SPSS). In class, we completed this assignment by hand with a class activity. Now, you will reperform this analysis using SPSS. SPSS Project #2.pdf (page 1 of 4) ✓ Here is a description of the research problem to refresh your memory: A researcher is examining the influence of biological sex and cortisol (a stress hormone) on the functional activity of a brain area called the amygdala that has been linked to aggressive behavior. The researcher randomly assigns his male and female subjects to three treatment groups: one that receives no cortisol (control), one that receives a small dose, and one that receives a large dose. The researcher shows his test subjects an anger-inducing picture while their brain is imaged under an fMRI scanner, and records the percent change in brain activity within the amygdala. Step by Step instructions to complete this assignment: 1. Download the SPSS Project #2 dataset (SPSS .sav file) that has been posted on Canvas. You do not need to enter any new data for this assignment! Open this file in SPSS. 2. Compare this data to your Two-Factor ANOVA in-class activity. Notice that for the independent variable "Sex", each subject has been coded with either a 1 (Male) or 2 (Female). For the independent variable "Treatment", each subject has been coded with either a 0 (Control), 1 (Small Dose), or 2 (Large Dose). 3. Perform Descriptive Statistics: mock. From the menus at the top of the program, choose Analyze > Compare Means > Means... • In the pop-up box titled "Means", choose the Dependent Variable (Activity). Place this in the section labeled "Dependent List". • Choose the first Independent Variable (Sex). Place this in the section labeled "Layer 1 of 1". . In the section titled "Layer 1 of 1", click Next. Choose the second Independent Variable (Treatment). Place this in the section labeled "Layer 2 of 2". . On the right side of the pop-up box, click Options... . Help W SPSS Project #2.pdf (page 2 of 4) . This is where you can choose what descriptive statistics to run on our 6 individual groups. Some of these are ready to go (Mean, Number of Cases, and Standard Deviation). Choose "Std. Error of Mean" from the Statistics section, and place it in the "Cell Statistics" section. Then, press "continue". • Press "OK" to run the analysis. • The statistics viewer will open, revealing all of your descriptive statistics for the individual groups! You need this information to complete your report. 4. Perform a Two-factor ANOVA and make a graph. • From the menus at the top of the program, choose Analyze > General Linear Model > Univariate... • In the pop-up box titled "Univariate", choose the Dependent Variable (Activity). Place this in the section labeled "Dependent Variable". • Choose both of your Independent Variables (Sex and Treatment). Place this in the section titled "Fixed Factors". . On the right side of the pop-up box, click Plots.... • In the pop-up box titled "Univariate: Profile Plots", Choose Sex, and place in the section titled "Separate Lines". • Choose Treatment, place it in the section titled "HorizontalAxis". • Press "Add". . In the section titled "Error Bars", check "Include Error Bars". Then, choose "Standard Error" and change the "Multiplier" to 1. I • Press Continue. Press OK • . The statistics viewer will reveal your completed two-factor ANOVA in the section titled "Tests of Between-Subjects Effects"! Look at the rows titled Sex, Treatment, Sex Treatment, and Error. Compare this to the two-factor ANOVA from your class activity. You will need this information to complete your report. . In the section titled "Profile Plots", you will find your line graph. Compare this to the line graph you completed in your two-factor ANOVA class activity. 5. Perform Post-hoc tests to compare Treatment groups within Males • Our goal is to perform post-hoc tests comparing Treatment within Sex. To do this, we will need to run two brand new one-way ANOVAs to compare Treatment within each Sex. . From the menus at the top of the program, choose Data> Select Cases... • Select "If condition is satisfied..." Press "if..." 12 809 W SPSS Project # 2.pdf (page 3 of 4) - • Choose Sex, and press the right arrow to place it in the box. • Next to word Sex, type "=1". • Press Continue. • Press OK. • Now, any statistics you run will only be performed on Males. • From the menus at the top of the program, choose Analyze > General Linear Model > Univariate... • In the pop-up box titled "Univariate", choose the Dependent Variable (Activity). Place this in the section labeled "Dependent Variable". . Choose ONLY THE INDEPENDENT VARIABLE CALLED "Treatment". Place this in the section titled "Fixed Factors". On the right side of the pop-up box, click "Post Hoc..." . • Choose the Independent Variable (Treatment). Place this in the section titled "Post Hoc Tests For". • In the section titled "Equal Variances Assumed", choose "Tukey". • Press Continue • Press OK. . The statistics viewer reveals an ANOVA comparing your three treatment groups, but only within Males. Scroll down to the section titled "Post Hoc Tests". This section shows the Mean differences for every possible comparison between treatment conditions, and precise significance (p)alues for each comparison. You will need these for your final report. 6. Finally, perform Post-hoc tests to compare Treatment within Females. • Repeat everything you did in Step 5, but when you select cases, you will choose "Sex = 2". This will perform the post-hoc tests only in Females. 12 SPSS Project #2.pdf (page 4 of 4) - Final Report: Prepare a brief summary (a paragraph or two) of your findings from this two-factor research study. Your report must include: W • Descriptive statistics (MEAN and STANDARD ERROR) from all 6 of your individual groups. • The results of your two-factor ANOVA-both MAIN EFFECTS and INTERACTIONS. State these in proper research report format and include the precise p-values you found in SPSS. • The line graph you created when performing the two-factor ANOVA in SPSS, with the standard error bars. • The results of your Tukey's post-hoc tests. Specifically, include all of the statistically significant Mean Differences you found from these tests and the precise p-values you found in SPSS. • In a concluding paragraph, summarize your overall final results. How does brain activity in response to cortisol treatment differ between Males and Females? You also need to provide me the complete SPSS output of your tests (Descriptive statistics, ANOVA, post-hoc tests, graphs). NOTE: THIS SPSS PROJECT #2 IS DUE AT 11:59PM ON FRIDAY, 12/13!!! U SPSS Project #2 The goal of this second SPSS project is to learn how to run descriptive statistics, Analysis of Variance (ANOVA), and post-hoc testing for a two-factor study in a statistics program (SPSS). In class, we completed this assignment by hand with a class activity. Now, you will reperform this analysis using SPSS. SPSS Project #2.pdf (page 1 of 4) ✓ Here is a description of the research problem to refresh your memory: A researcher is examining the influence of biological sex and cortisol (a stress hormone) on the functional activity of a brain area called the amygdala that has been linked to aggressive behavior. The researcher randomly assigns his male and female subjects to three treatment groups: one that receives no cortisol (control), one that receives a small dose, and one that receives a large dose. The researcher shows his test subjects an anger-inducing picture while their brain is imaged under an fMRI scanner, and records the percent change in brain activity within the amygdala. Step by Step instructions to complete this assignment: 1. Download the SPSS Project #2 dataset (SPSS .sav file) that has been posted on Canvas. You do not need to enter any new data for this assignment! Open this file in SPSS. 2. Compare this data to your Two-Factor ANOVA in-class activity. Notice that for the independent variable "Sex", each subject has been coded with either a 1 (Male) or 2 (Female). For the independent variable "Treatment", each subject has been coded with either a 0 (Control), 1 (Small Dose), or 2 (Large Dose). 3. Perform Descriptive Statistics: mock. From the menus at the top of the program, choose Analyze > Compare Means > Means... • In the pop-up box titled "Means", choose the Dependent Variable (Activity). Place this in the section labeled "Dependent List". • Choose the first Independent Variable (Sex). Place this in the section labeled "Layer 1 of 1". . In the section titled "Layer 1 of 1", click Next. Choose the second Independent Variable (Treatment). Place this in the section labeled "Layer 2 of 2". . On the right side of the pop-up box, click Options... . Help W SPSS Project #2.pdf (page 2 of 4) . This is where you can choose what descriptive statistics to run on our 6 individual groups. Some of these are ready to go (Mean, Number of Cases, and Standard Deviation). Choose "Std. Error of Mean" from the Statistics section, and place it in the "Cell Statistics" section. Then, press "continue". • Press "OK" to run the analysis. • The statistics viewer will open, revealing all of your descriptive statistics for the individual groups! You need this information to complete your report. 4. Perform a Two-factor ANOVA and make a graph. • From the menus at the top of the program, choose Analyze > General Linear Model > Univariate... • In the pop-up box titled "Univariate", choose the Dependent Variable (Activity). Place this in the section labeled "Dependent Variable". • Choose both of your Independent Variables (Sex and Treatment). Place this in the section titled "Fixed Factors". . On the right side of the pop-up box, click Plots.... • In the pop-up box titled "Univariate: Profile Plots", Choose Sex, and place in the section titled "Separate Lines". • Choose Treatment, place it in the section titled "HorizontalAxis". • Press "Add". . In the section titled "Error Bars", check "Include Error Bars". Then, choose "Standard Error" and change the "Multiplier" to 1. I • Press Continue. Press OK • . The statistics viewer will reveal your completed two-factor ANOVA in the section titled "Tests of Between-Subjects Effects"! Look at the rows titled Sex, Treatment, Sex Treatment, and Error. Compare this to the two-factor ANOVA from your class activity. You will need this information to complete your report. . In the section titled "Profile Plots", you will find your line graph. Compare this to the line graph you completed in your two-factor ANOVA class activity. 5. Perform Post-hoc tests to compare Treatment groups within Males • Our goal is to perform post-hoc tests comparing Treatment within Sex. To do this, we will need to run two brand new one-way ANOVAs to compare Treatment within each Sex. . From the menus at the top of the program, choose Data> Select Cases... • Select "If condition is satisfied..." Press "if..." 12 809 W SPSS Project # 2.pdf (page 3 of 4) - • Choose Sex, and press the right arrow to place it in the box. • Next to word Sex, type "=1". • Press Continue. • Press OK. • Now, any statistics you run will only be performed on Males. • From the menus at the top of the program, choose Analyze > General Linear Model > Univariate... • In the pop-up box titled "Univariate", choose the Dependent Variable (Activity). Place this in the section labeled "Dependent Variable". . Choose ONLY THE INDEPENDENT VARIABLE CALLED "Treatment". Place this in the section titled "Fixed Factors". On the right side of the pop-up box, click "Post Hoc..." . • Choose the Independent Variable (Treatment). Place this in the section titled "Post Hoc Tests For". • In the section titled "Equal Variances Assumed", choose "Tukey". • Press Continue • Press OK. . The statistics viewer reveals an ANOVA comparing your three treatment groups, but only within Males. Scroll down to the section titled "Post Hoc Tests". This section shows the Mean differences for every possible comparison between treatment conditions, and precise significance (p)alues for each comparison. You will need these for your final report. 6. Finally, perform Post-hoc tests to compare Treatment within Females. • Repeat everything you did in Step 5, but when you select cases, you will choose "Sex = 2". This will perform the post-hoc tests only in Females. 12 SPSS Project #2.pdf (page 4 of 4) - Final Report: Prepare a brief summary (a paragraph or two) of your findings from this two-factor research study. Your report must include: W • Descriptive statistics (MEAN and STANDARD ERROR) from all 6 of your individual groups. • The results of your two-factor ANOVA-both MAIN EFFECTS and INTERACTIONS. State these in proper research report format and include the precise p-values you found in SPSS. • The line graph you created when performing the two-factor ANOVA in SPSS, with the standard error bars. • The results of your Tukey's post-hoc tests. Specifically, include all of the statistically significant Mean Differences you found from these tests and the precise p-values you found in SPSS. • In a concluding paragraph, summarize your overall final results. How does brain activity in response to cortisol treatment differ between Males and Females? You also need to provide me the complete SPSS output of your tests (Descriptive statistics, ANOVA, post-hoc tests, graphs). NOTE: THIS SPSS PROJECT #2 IS DUE AT 11:59PM ON FRIDAY, 12/13!!! U
Expert Answer:
Answer rating: 100% (QA)
SPSS Project 2 Analysis of Cortisol and Sex on Amygdala Activity This report summarizes the findings of a twofactor study investigating the influence ... View the full answer

Related Book For 

Statistical Techniques in Business and Economics
ISBN: 978-1259666360
17th edition
Authors: Douglas A. Lind, William G Marchal
Posted Date:
Students also viewed these accounting questions
-
The purpose of this exercise is to learn how to calculate stock returns for portfolio models using actual stock price data. Ten years worth of stock price data are included in the file StockReturns...
-
A goal of financial literacy for children is to learn how to manage money wisely. One question is: How much money do children have to manage? A recent study by Schnur Educational Research Associates...
-
The purpose of this exercise is to learn how to calculate stock returns for portfolio models using actual stock price data. First, it is necessary to obtain stock price data. One source (of many) is...
-
Assume a portfolio of two assets, with $10m invested in asset 1 and $5m invested in asset 2. The per pound covariance matrix of the two assets is: Asset 1 Asset 2 The best hedge of asset 2 is: Asset...
-
Indicate which of the following errors, each considered individually, would cause the trial balance totals to be unequal: a. A payment of $7,000 for equipment purchased was posted as a debit of $700...
-
The mean of a population of raw scores is 18 (x = 12). (a) Using the z-table, what is the relative frequency of sample means above 24 when N = 30? (b) What is the probability of randomly selecting a...
-
Use your calculator to calculate 38 - 100. Explain how the answer agrees with what was expected.
-
In 2013, the Westgate Construction Company entered into a contract to construct a road for Santa Clara County for $10,000,000. The road was completed in 2015. Information related to the contract is...
-
zeker and associates audits a condominium association in which the parents of a member of the firm own a unit and reside. the unit is material to the parents net worth, and the member participates in...
-
The yield on a general obligation bond for the city of Davenport fluctuates with the market. The monthly quotations for 2006 are given in Table P-9. Table P-9 MonthYield January ............. 9.29...
-
Using the data in the following table, estimate (a) the average return and volatility for each stock, (b) the covariance between the stocks, and (c) the correlation between these two stocks. year...
-
TFC is considering the introduction of a juice maker that will allow them to sell "juice pods" of concentrated juice that will then be processed in the juice maker by the end consumer, much like a...
-
"Without making any calculations, could you derive a good approximation of the Throughput for the production line with a Full Cross-Training Policy (FXT)? Both workers 1 and 2 are trained to help at...
-
The density of toluene (C7 Hs) is 0.867 g/mL, and the density of thiophene (CH4S) is 1.065 g/mL. A solution is made by dissolving 8.00 g of thiophene in 230.0 mL of toluene.
-
Consider the 3D curve given by the parametric equations x(t) = sint, y(t) = cos(2t), z(t)=t, for t [0, 3]. (a) Use the "plot3" command in MATLAB to plot the 3D curve. (b) From calculus, it is known...
-
Win Win Limited is a robot manufacturer to be sold to another tech firm at the end of one year. Win Win expects that the net cash flow at the end of one year will be USD40 million, a record high of...
-
Bottoms Up Diaper Service is considering the purchase of a new industrial washer. It can purchase the washer for $8,400 and sell its old washer for $2,400. The new washer will last for 6 years and...
-
Beginning with a country that has a trade deficit, demonstrate graphically what will happen to a countrys potential output with globalization if that countrys costs of production fall. Explain your...
-
An investor purchased 200 shares of the Blair Company for $36 each in July of 2013, 300 shares at $40 each in September 2015, and 500 shares at $50 each in January 2016. What is the investors...
-
A goal of financial literacy for children is to learn how to manage money wisely. One question is: How much money do children have to manage? A recent study by Schnur Educational Research Associates...
-
Refer to the following table. a. Determine P(A 1 ). b. Determine P(B 1 | A 2 ). c. Determine P(B 2 and A 3 ). Flrst Event Second Event A, A, 3 Total A, B, 2 B2 Total 3 4 10 3
-
5. Eads Transfer, Inc., was a moving and storage company with a small workforce represented by the General Teamsters, Chauffeurs and Helpers Union. When the CBA expired, the parties failed to reach...
-
6. Olivetti Office U.S.A., Inc., was located in Newington, Connecticut, and its workers were represented by the United Automobile, Aerospace, and Agriculture Implement Workers of America. The...
-
9. ETHICS The chapter refers in several places to the contentious issue of subcontracting. Make an argument for management in favor of a company's ethical right to subcontract, and one for unions in...

Study smarter with the SolutionInn App