

Using Figure 9.2 (p. 207), suppose P 0 is $10 and P 1 $11. Suppose a new
Question:
Using Figure 9.2 (p. 207), suppose P0 is $10 and P1 $11. Suppose a new firm with the same LRAC curve as the incumbent (existing firm) tries to break into the market by selling 4,000 units of output. (Taylor & Greenlaw, 2014, p. 223).
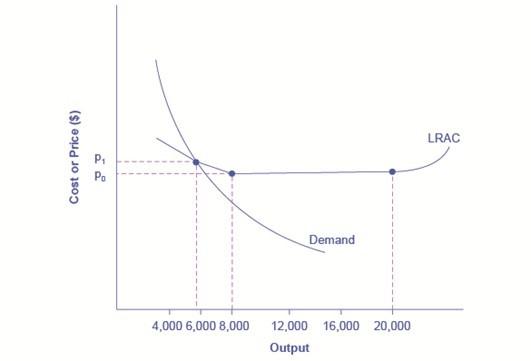
Estimate from LRAC on the graph what the new firm’s average cost of producing output of 4,000 would be. Highlight the correct answer:
$10.50 $11 $12.50 $17
If the existing supplier continues to produce 6,000 units, how much output would be supplied to the market by both firms together? (Add)
Answer: ___________ units.
Estimate what would happen to the market price as a result of the increased supply of this combined output. Use the Demand Curve to decide what will happen to the price at this increased total output of both firms.
Circle the correct answer:
A1. It will rise to about $16
A2. It will fall to about $12
A3. It will fall to about $6
A4. It will rise to about $9
Estimate how much profit/loss would each firm make? Highlight the correct answer:
A1. Both firms will make a loss
A2. Both firms will make good profits
A3. Only the original company will make a profit, and the new company will make a loss in the long run.
A4. The original company will make a loss and the new company will make a profit
Expert Answer:


