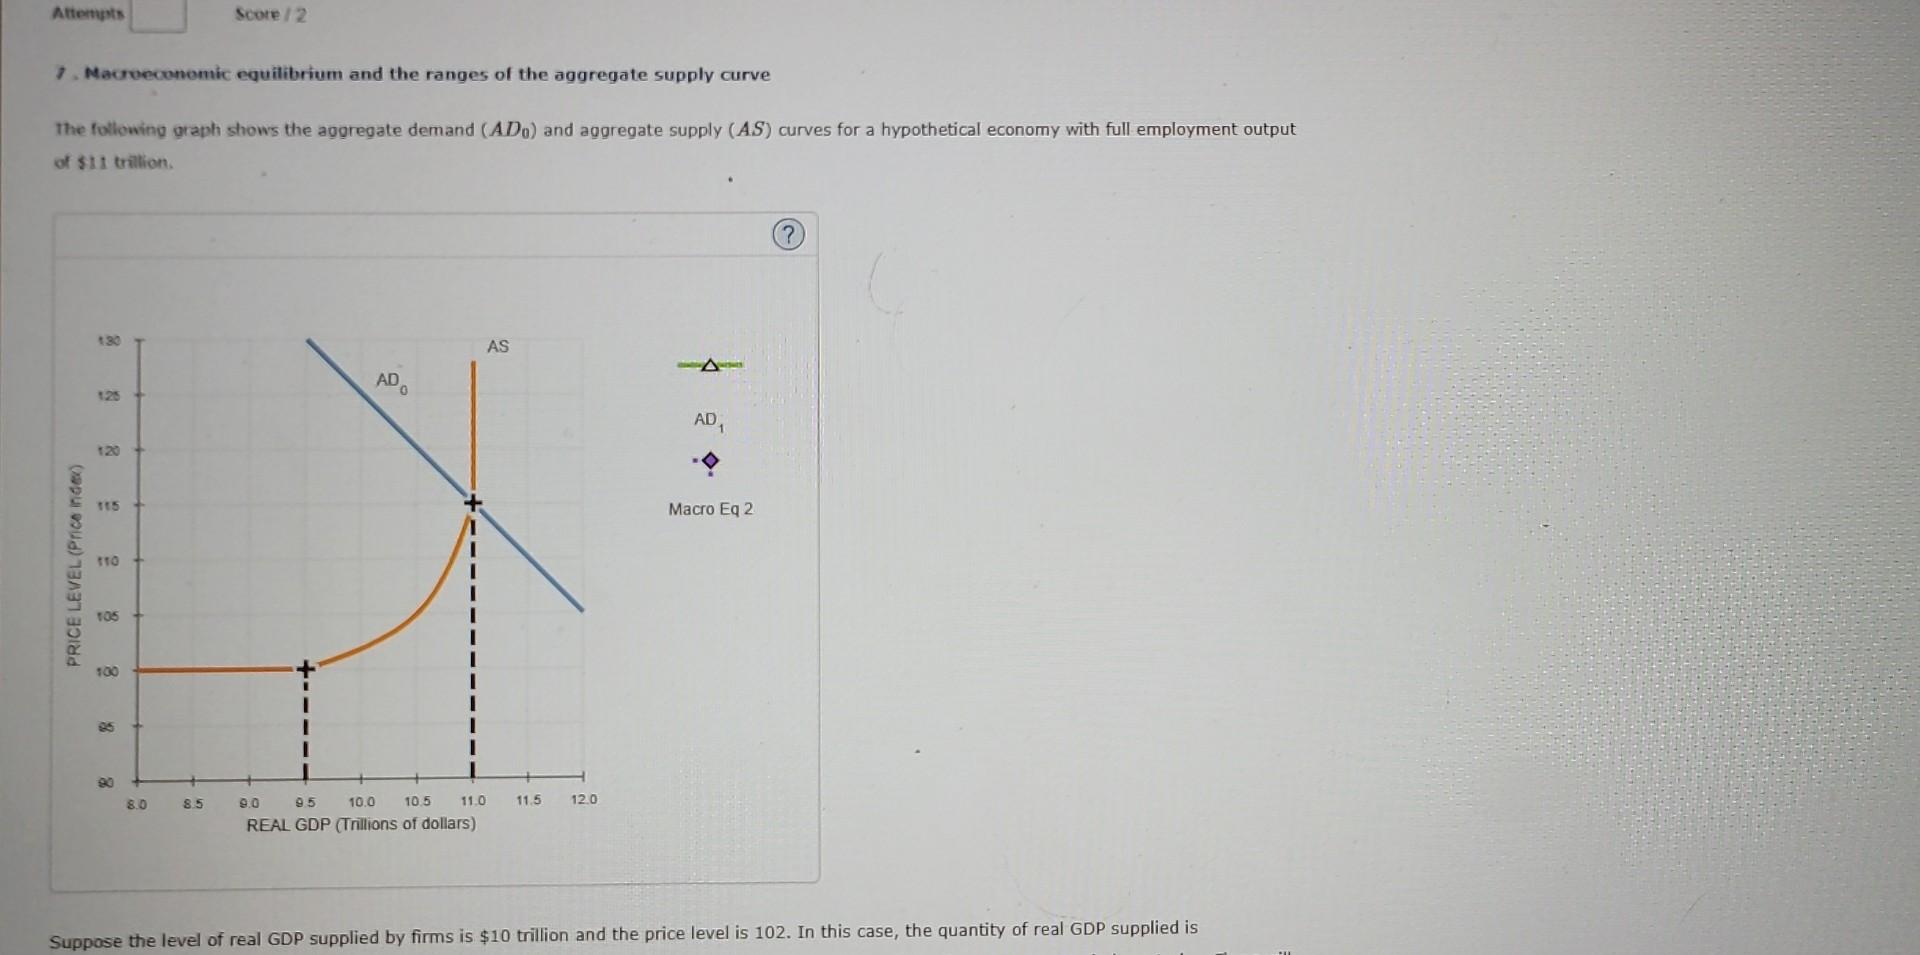
Suppose the level of real GDP supplied by firms is $10 trillion and the price level...
Fantastic news! We've Found the answer you've been seeking!
Question:
Transcribed Image Text:
Suppose the level of real GDP supplied by firms is $10 trillion and the price level is 102. In this case, the quantity of real GDP supplied is the real GDP demanded at a price level of 102, and firms will experience an unplanned respond to the change in inventories by producing real GDP of $ trillion. in inventories. Firms will output until the economy reaches macroeconomic equilibrium at a price level of and Suppose consumers and businesses become less optimistic about future economic conditions, causing the aggregate demand curve to decrease by $1.5 trillion at each price level. On the previous graph, use the green line (triangle symbol) to show the new aggregate demand curve (AD). (Hint: Be sure that AD, is parallel to AD.) Then use the purple point (diamond symbol) to indicate the new macroeconomic equilibrium after the shift of aggregate demand. (Note: Dashed drop lines will automatically extend to both axes.) Save & Continue Attempts Score/2 7. Macroeconomic equilibrium and the ranges of the aggregate supply curve The following graph shows the aggregate demand (AD) and aggregate supply (AS) curves for a hypothetical economy with full employment output of $11 trillion. PRICE LEVEL (Price Index) 130 So AS AD 125 120 115 110 105 100 85 90 8.0 8.5 9.0 10.0 95 REAL GDP (Trillions of dollars) 10.5 11.0 11.5 12.0 AD Macro Eq 2 Suppose the level of real GDP supplied by firms is $10 trillion and the price level is 102. In this case, the quantity of real GDP supplied is Suppose the level of real GDP supplied by firms is $10 trillion and the price level is 102. In this case, the quantity of real GDP supplied is the real GDP demanded at a price level of 102, and firms will experience an unplanned respond to the change in inventories by producing real GDP of $ trillion. in inventories. Firms will output until the economy reaches macroeconomic equilibrium at a price level of and Suppose consumers and businesses become less optimistic about future economic conditions, causing the aggregate demand curve to decrease by $1.5 trillion at each price level. On the previous graph, use the green line (triangle symbol) to show the new aggregate demand curve (AD). (Hint: Be sure that AD, is parallel to AD.) Then use the purple point (diamond symbol) to indicate the new macroeconomic equilibrium after the shift of aggregate demand. (Note: Dashed drop lines will automatically extend to both axes.) Save & Continue Attempts Score/2 7. Macroeconomic equilibrium and the ranges of the aggregate supply curve The following graph shows the aggregate demand (AD) and aggregate supply (AS) curves for a hypothetical economy with full employment output of $11 trillion. PRICE LEVEL (Price Index) 130 So AS AD 125 120 115 110 105 100 85 90 8.0 8.5 9.0 10.0 95 REAL GDP (Trillions of dollars) 10.5 11.0 11.5 12.0 AD Macro Eq 2 Suppose the level of real GDP supplied by firms is $10 trillion and the price level is 102. In this case, the quantity of real GDP supplied is
Expert Answer:
Answer rating: 100% (QA)
I will generate an image that represents the shift in the aggregate demand curve due to a decrease i... View the full answer
Related Book For
Posted Date:
Students also viewed these economics questions
-
KYC's stock price can go up by 15 percent every year, or down by 10 percent. Both outcomes are equally likely. The risk free rate is 5 percent, and the current stock price of KYC is 100. (a) Price a...
-
Consider the following reaction: 2 NO(g) 2 N(g) + O(g) part A: Express the rate of the reaction in terms of the change in concentration of each of the reactants and products. Part B: In the first...
-
Air France-KLM (AF), a Franco-Dutch company, prepares its financial statements according to International Financial Reporting Standards. AF's financial statements and disclosure notes for the year...
-
How does geopolitical instability in major energy-producing regions affect global energy security and international trade dynamics ?
-
Car manufacturer Lexus competes in the luxury car category and is known for its quality. The decision to compete on quality rather than low cost is an example of what type of decision: strategic,...
-
Cari Hawkins is a 50% partner in the calendar year Hawkins-Henry Partnership. On January 1, 2015, her basis in her partnership interest is $160,000. The partnership has no taxable income or loss for...
-
A. What interim reporting requirements would the company have as a corporation? 1. Describe the guidance related to interim financial reporting under generally accepted accounting principles (GAAP)...
-
A manufacturer uses risk neutral valuation to assess the value of an opportunity to expand its business. What do you know about the risk attitude of the manufacturer?
-
Evaluate Starbucks' extension decisions: to put Starbucks on airlines, to open Starbucks in bookstores, to open Starbucks outlets in grocery chains, to license Starbucks ice cream, to offer oatmeal,...
-
What firms have changed from components to offering systems? Have they obtained an innovator's advantage?
-
How could the problems with the DaimlerChrysler merger have been avoided? Was the problem one of strategy (ov erexpansion), or was it organizational? Why?
-
Consider a divestment strategy. Why is it hard to divest a business? Identify some cases of divestment. What are some of the motivations that led to these divestments?
-
How serious are the environmental concerns arising from the launch and sales of the Tata Nano? To whom are these of most concern? Are the environmental costs outweighed by the improvement in the...
-
The following bar chart shows the number of customers using various models of washing machines. Identify the mode(s) for this dataset. Select all that apply. Frequency Distribution of Customers Using...
-
Repeat the previous problem, but close the positions on September 20. Use the spreadsheet to find the profits for the possible stock prices on September 20. Generate a graph and use it to identify...
-
Angela has a monthly income of $120, which she spends on MP3s and a composite good (whose price you may assume is $1 throughout this problem). Currently, she does not belong to an MP3 club, so she...
-
For each of the following, discuss whether you expect the elasticity (of demand or of supply, as specified) to be greater in the long run or the short run. a) The supply of seats in the local movie...
-
How might bundling increase a firm's profits? When is bundling not likely to increase profits?
-
Compare and discuss the estimated longitudinal compressive strengths of Scotchply 1002 E-glass/epoxy based on (a) fiber microbuckling and (b) transverse tensile rupture. Assume linear elastic...
-
Using the maximum strain criterion and micromechanics, set up the equations for predicting the averaged isotropic strength of a randomly oriented continuous fiber composite. Your answer should be...
-
For a cylindrical particle, derive the relationship between the ratio of surface area to volume, A/V, and the particle aspect ratio, l/d, and verify the shape of the curve shown in Figure 1.3. FIGURE...
Study smarter with the SolutionInn App