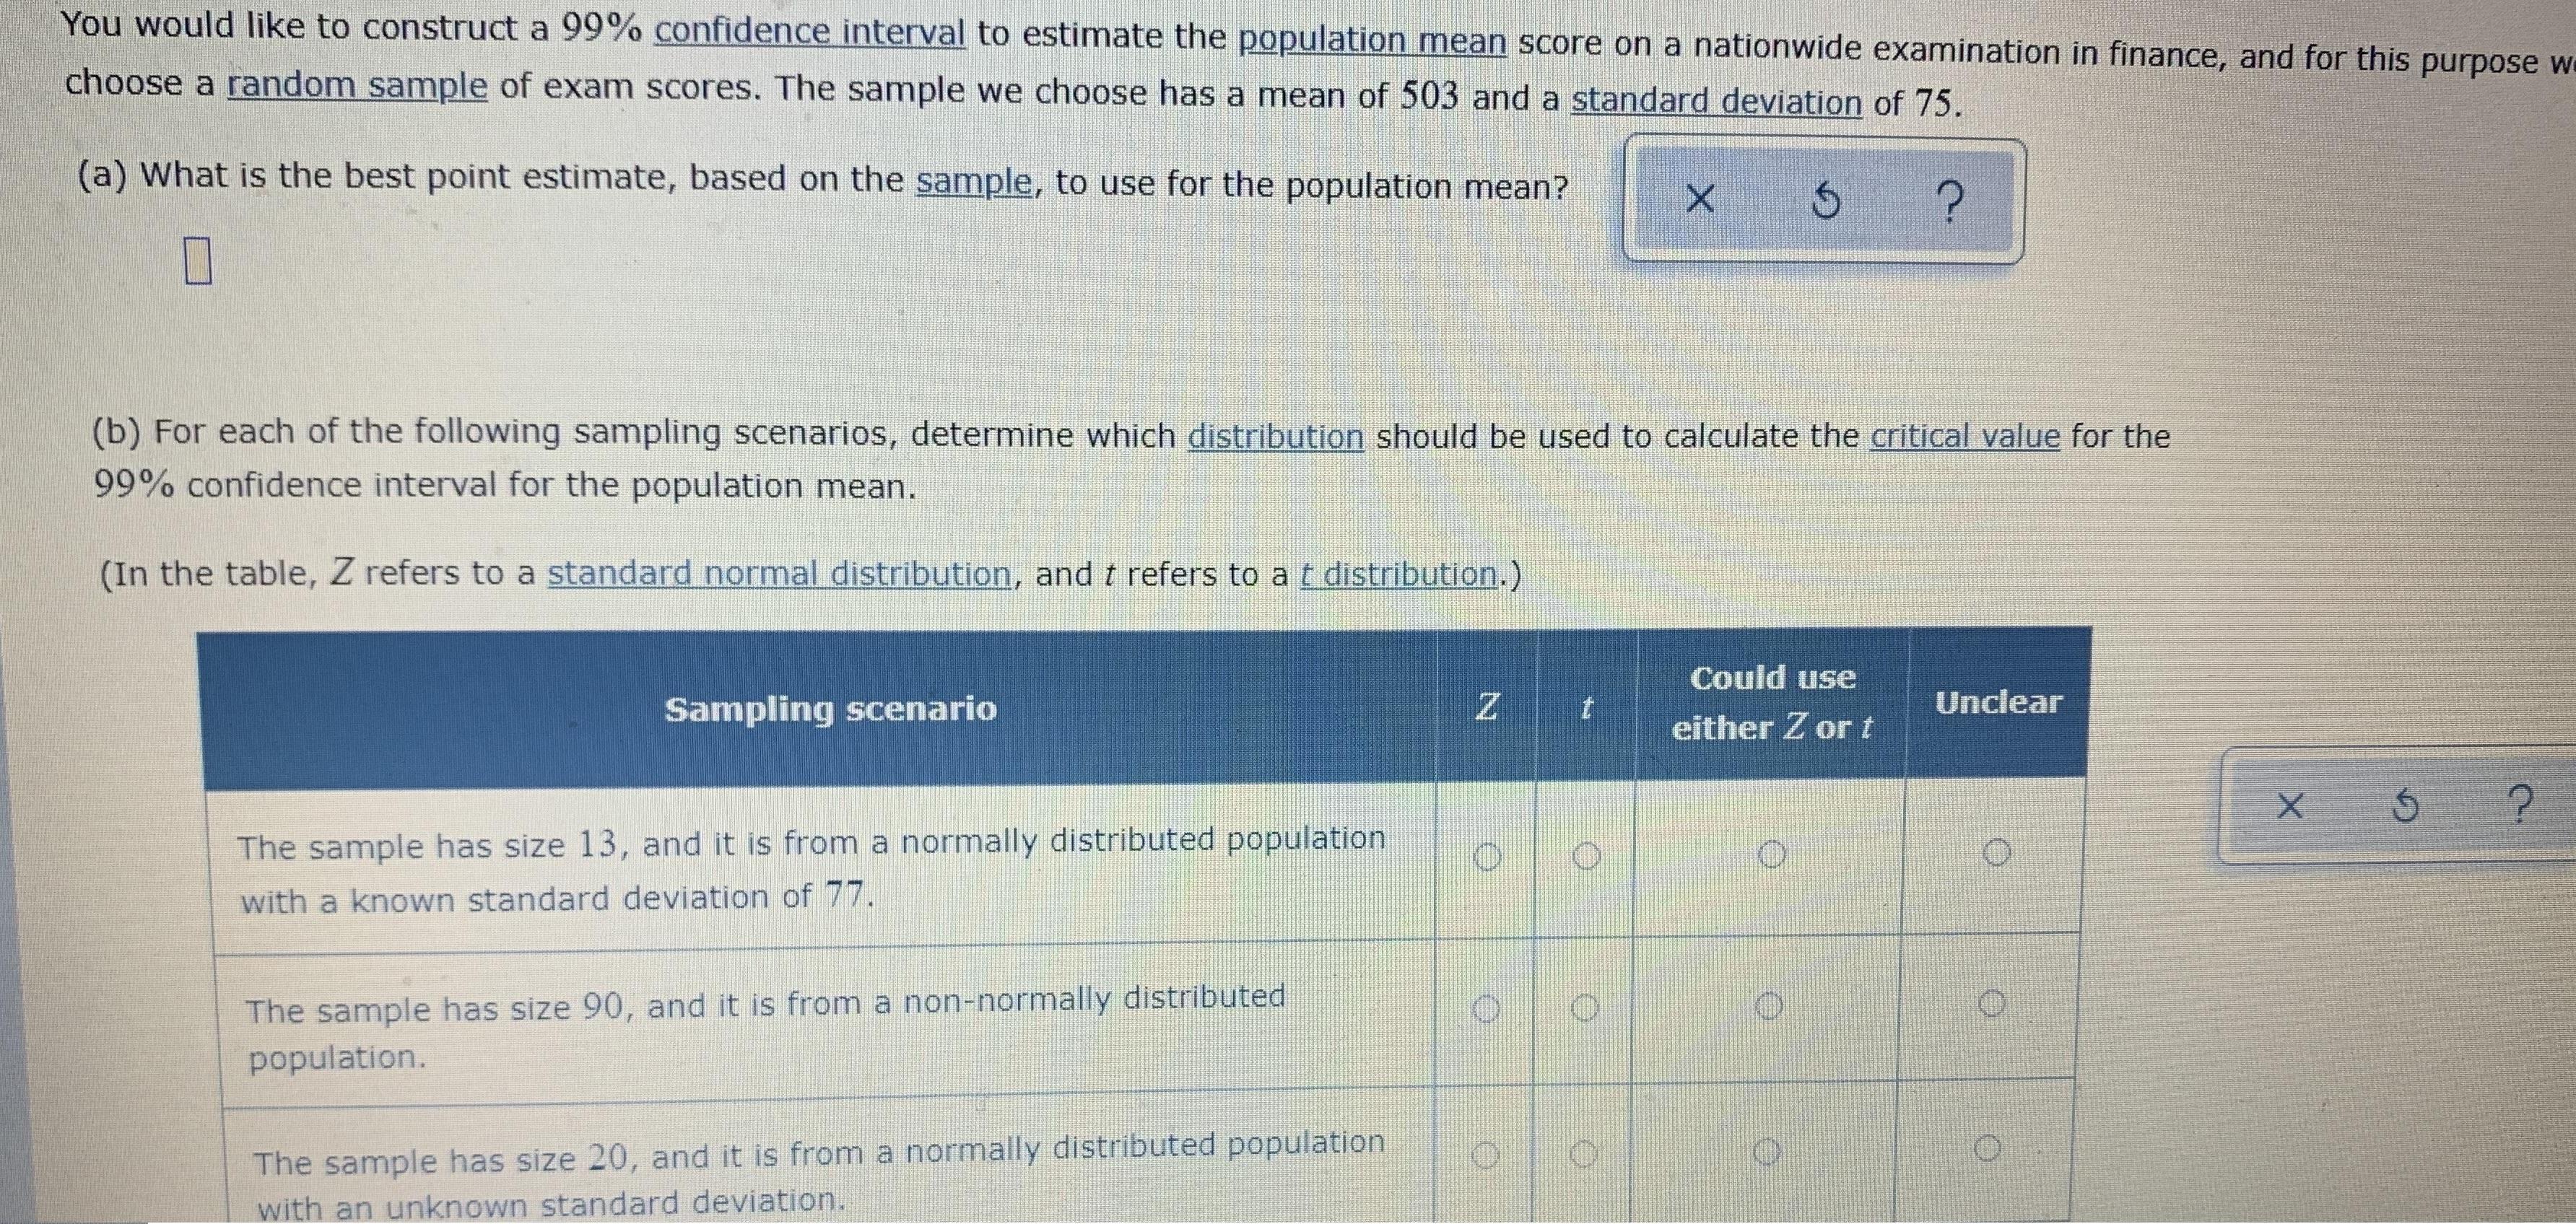
You would like to construct a 99% confidence interval to estimate the population mean score on...
Fantastic news! We've Found the answer you've been seeking!
Question:
Transcribed Image Text:
You would like to construct a 99% confidence interval to estimate the population mean score on a nationwide examination in finance, and for this purpose we choose a random sample of exam scores. The sample we choose has a mean of 503 and a standard deviation of 75. (a) What is the best point estimate, based on the sample, to use for the population mean? (b) For each of the following sampling scenarios, determine which distribution should be used to calculate the critical value for the 99% confidence interval for the population mean. (In the table, Z refers to a standard normal distribution, and t refers to a t distribution,) Could use Unclear Sampling scenario either Z or t The sample has size 13, and it is from a normally distributed population with a known standard deviation of 77. The sample has size 90, and it is from a non-normally distributed population. The sample has size 20, and it is from a normally distributed population with an unknown standard deviation. You would like to construct a 99% confidence interval to estimate the population mean score on a nationwide examination in finance, and for this purpose we choose a random sample of exam scores. The sample we choose has a mean of 503 and a standard deviation of 75. (a) What is the best point estimate, based on the sample, to use for the population mean? (b) For each of the following sampling scenarios, determine which distribution should be used to calculate the critical value for the 99% confidence interval for the population mean. (In the table, Z refers to a standard normal distribution, and t refers to a t distribution,) Could use Unclear Sampling scenario either Z or t The sample has size 13, and it is from a normally distributed population with a known standard deviation of 77. The sample has size 90, and it is from a non-normally distributed population. The sample has size 20, and it is from a normally distributed population with an unknown standard deviation.
Expert Answer:
Related Book For
Posted Date:
Students also viewed these mathematics questions
-
Construct a 90% confidence interval to estimate the population mean using the following data: x = 75 = 20 n = 36
-
Construct a 90% confidence interval to estimate the population mean using the following data: x = 25 = 5.2 n = 21 What assumptions need to be made about this population?
-
Construct a 95% confidence interval to estimate the population mean using the following data: x = 38 = 8.5 n = 25 What assumptions need to be made about this population?
-
What are the advantages and disadvantages of decentralization? Would you prefer to work in a centralized or decentralized organization and why? What are opportunity costs and what are the economic...
-
If we use the listed pulse rates with suitable methods of statistics, we conclude that when the 64.0 average (mean) of the pulse rates of the five males is compared to the 69.6 average (mean) of the...
-
Use the Scatchard-Hildebrand theory to generate figures of activity as a function of composition and G mix as a function of composition for neopentane and dichloromethane at 0C. Determine the...
-
An example of the extreme degree of professionalism required of accountants is: a. working for relatively low salaries b. safeguarding of outstanding business success c. prestigious title (C.P.A) d....
-
The Hit-and-Miss Manufacturing Company produces items that have a probability p of being defective. These items are produced in lots of 150. Past experience indicates that p for an entire lot is...
-
ABC Inc. has the following information available for one of its divisions: Average operatingassets$5 000 000 Return on investment(ROI)60% Sales$8 000 000 If ABC requires a minimum return on its...
-
You are the IT director at Big Ten University. As part of a training program, you decide to draw a DM that includes some obvious mistakes to see whether your newly hired junior analysts can find...
-
I am in the Army and just signed up for ILE Intermediate Level Education Phase 1 of 3. This is an 18 month program online. I am looking for insight on some of the tests. Are those on your site?
-
The First Manufacturing manufactures several designs of custom made tables. Production costs are accounted for using a job order cost system. During the current period, 200 tables are manufactured on...
-
#11, 12, 13, 17, 19, 20, 21, 22, 25, 26, 29 (a, c, g, h), 31 and 32. Sorry for all the questions, I just hate paying 3 dollars per question. Thank you for the help. arterly 10. If I = Prt and P =...
-
(Use your own words !!!, similarities will be 2.5. The stress-strain diagram of a concrete specimen under compressive loads is usually represented by a parabola up to the ultimate strength with the...
-
Hello everyone, I hope everyone Is having a good week and learning lots. This week has us going over the project estimation process. The project estimation process I have chosen to go over form this...
-
Jim Collins describes the levels of leadership with Level 5 Leadership being what he often saw in many of the CEOs of the great companies in his book. What level of leadership do you see yourself and...
-
Explain the meaning of 'assurance' in the context of financial reporting. (7marks)
-
Arlington Merchants reported the following on its income statement for the fiscal years ending December 31, 2016 and 2015. 2016 2015 Sales $4,857,500 $4,752,900 Cost of goods sold 3,258,950 3,207,000...
-
Suppose the Bank of Delaware would like to develop a regression model to predict a persons credit score based on his or her age, weekly income, education level (high school, bachelors degree,...
-
With a capacity of 6,300 people, Royal Caribbeans Oasis of the Seas is the worlds largest cruise ship. The average beer consumption over 15 randomly selected seven day cruises on the ship was 81,740...
-
Consider the following time series: a. Use PH Stat and set = 0.05 to test this time series for positive autocorrelation. b. Verify your Durbin Watson statistic using Excel. 186175 a11211 112345...
-
Analyse all variances relating to material, labour, overhead and sales.
-
Apply diff erent methods of accounting treatment of variances.
-
Prepare reports of variances to management.
![Mobile App Logo](https://dsd5zvtm8ll6.cloudfront.net/includes/images/mobile/finalLogo.png)
Study smarter with the SolutionInn App