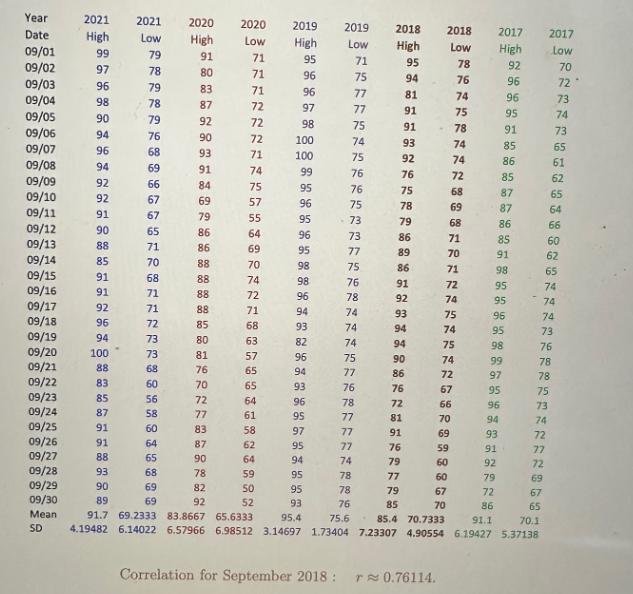
The data set provided in the following page shows the daily high and the daily low...
Fantastic news! We've Found the answer you've been seeking!
Question:
Transcribed Image Text:
The data set provided in the following page shows the daily high and the daily low temperatures of DFW Airport, for the month of September, from 2017 to 2021. Answer the following problems. Be sure to show all necessary justification. (la) Find the five number summaries of the daily high and the daily low temperature of September 2018, and produce a side-by-side box whiskers chart. (1b) Produce a side-by-side histogram for September 2018. (1c) Use the method of linear regression on September 2018 data to find the best point estimate of the daily high temperature if the daily low is 75 degrees. (1d) Use the method of linear regression on September 2018 data to find the best point estimate of the daily low temperature if the daily high is 90 degrees. Year Date 09/01 09/02 09/03 09/04 09/05 09/06 09/07 09/08 09/09 09/10 09/11 09/12 09/13 09/14 09/15 09/16 09/17 09/18 09/19 09/20 09/21 09/22 09/23 09/24 09/25 09/26 09/27 09/28 09/29 09/30 Mean SD 2021 High 99 97 96 98 90 94 96 94 92 92 91 90 88 85 91 91 92 96 94 100 88 83 85 87 91 91 88 93 2021 Low 79 78 79 78 79 90 89 76 8865551 69 66 67 67 71 70 72 73 73 0 68 117 8 8 35和5 58 50 科 65 65 74 75 7 55 4 904218375650 1 58 2 0 59 50 52 70 72 刀 3 5 90 78 68 60 56 60 64 68 2020 High 81 80 69 69 91 80 83 87 92 90 93 91 84 69 79 86 86 88 88 88 88 85 80 81 76 77 83 87 2020 Low 71 71 82 92 71 72 72 72 71 57 64 61 62 64 2019 High 95 96 96 97 98 100 100 99 95 96 95 96 95 98 98 96 94 93 82 96 94 93 96 95 97 95 94 95 2019 Low 71 75 77 77 75 74 75 76 76 75 73 73 77 557847445758刀刀刀 78 76 76 74 78 76 2018 High 95 94 81 91 75 78 79 76 86 89 86 91 92 91 93 92 93 £ 94 94 90 86 76 72 81 91 76 79 77 79 85 2018 Low 78 76 74 75 78 Correlation for September 2018: r≈0.76114. 71 71 70 72 74 74 68 69 68 74 72 75 74 72 60 75 74 67 66 70 69 59 60 67 70 96 93 91 2017 High 92 92 86 96 96 95 91 85 91.1 86 96 85 的 35 3577 36 351895595598 997 95594 3 1 2 79 72 35 65 66 60 句 65444万元祖285242刀刀的研 65 87 87 86 95 93 95.4 75.6 • 85.4 70.7333 91.7 69.2333 83.8667 65.6333 4.19482 6.14022 6.57966 6.98512 3.14697 1.73404 7.23307 4.90554 6.19427 5.37138 78 75 2017 Low 70 72 73 74 74 73 76 78 73 74 74 74 72 62 77 69 72 67 70.1 64 73 65 61 62 The data set provided in the following page shows the daily high and the daily low temperatures of DFW Airport, for the month of September, from 2017 to 2021. Answer the following problems. Be sure to show all necessary justification. (la) Find the five number summaries of the daily high and the daily low temperature of September 2018, and produce a side-by-side box whiskers chart. (1b) Produce a side-by-side histogram for September 2018. (1c) Use the method of linear regression on September 2018 data to find the best point estimate of the daily high temperature if the daily low is 75 degrees. (1d) Use the method of linear regression on September 2018 data to find the best point estimate of the daily low temperature if the daily high is 90 degrees. Year Date 09/01 09/02 09/03 09/04 09/05 09/06 09/07 09/08 09/09 09/10 09/11 09/12 09/13 09/14 09/15 09/16 09/17 09/18 09/19 09/20 09/21 09/22 09/23 09/24 09/25 09/26 09/27 09/28 09/29 09/30 Mean SD 2021 High 99 97 96 98 90 94 96 94 92 92 91 90 88 85 91 91 92 96 94 100 88 83 85 87 91 91 88 93 2021 Low 79 78 79 78 79 90 89 76 8865551 69 66 67 67 71 70 72 73 73 0 68 117 8 8 35和5 58 50 科 65 65 74 75 7 55 4 904218375650 1 58 2 0 59 50 52 70 72 刀 3 5 90 78 68 60 56 60 64 68 2020 High 81 80 69 69 91 80 83 87 92 90 93 91 84 69 79 86 86 88 88 88 88 85 80 81 76 77 83 87 2020 Low 71 71 82 92 71 72 72 72 71 57 64 61 62 64 2019 High 95 96 96 97 98 100 100 99 95 96 95 96 95 98 98 96 94 93 82 96 94 93 96 95 97 95 94 95 2019 Low 71 75 77 77 75 74 75 76 76 75 73 73 77 557847445758刀刀刀 78 76 76 74 78 76 2018 High 95 94 81 91 75 78 79 76 86 89 86 91 92 91 93 92 93 £ 94 94 90 86 76 72 81 91 76 79 77 79 85 2018 Low 78 76 74 75 78 Correlation for September 2018: r≈0.76114. 71 71 70 72 74 74 68 69 68 74 72 75 74 72 60 75 74 67 66 70 69 59 60 67 70 96 93 91 2017 High 92 92 86 96 96 95 91 85 91.1 86 96 85 的 35 3577 36 351895595598 997 95594 3 1 2 79 72 35 65 66 60 句 65444万元祖285242刀刀的研 65 87 87 86 95 93 95.4 75.6 • 85.4 70.7333 91.7 69.2333 83.8667 65.6333 4.19482 6.14022 6.57966 6.98512 3.14697 1.73404 7.23307 4.90554 6.19427 5.37138 78 75 2017 Low 70 72 73 74 74 73 76 78 73 74 74 74 72 62 77 69 72 67 70.1 64 73 65 61 62
Expert Answer:
Answer rating: 100% (QA)
Thank you for providing the temperature data for September 2018 Based on the data you provided I will now help you with the requested problems la Five... View the full answer
Related Book For
Posted Date:
Students also viewed these accounting questions
-
Planning is one of the most important management functions in any business. A front office managers first step in planning should involve determine the departments goals. Planning also includes...
-
Read the case study "Southwest Airlines," found in Part 2 of your textbook. Review the "Guide to Case Analysis" found on pp. CA1 - CA11 of your textbook. (This guide follows the last case in the...
-
List three specific parts of the Case Guide, Objectives and Strategy Section (See below) that you had the most difficulty understanding. Describe your current understanding of these parts. Provide...
-
How can your knowledge of meat and meat cookery be used to understand protein substitutions for vegan dishes, such as tofu, texturized soy protein, grains, or beans?
-
Determine the smallest horizontal force P required to lift the 100-kg cylinder. The coefficients of static friction at the contact points A and B are (? s ) A = 0.6 and (? s ) B = 0.2, respectively;...
-
Toyota regularly takes its own cars in trade for new models. It then subjects them to a rigorous inspection process, fixing defects as it goes, and offers them for sale with an extended warranty....
-
Prove that the predictable It's formula is \[\begin{aligned}F\left(t, X_{t} ight)= & F\left(0, X_{0} ight)+\int_{0}^{t} \partial_{s} F\left(s, X_{s} ight) d s \\& +\sum_{i=1}^{d} \int_{0}^{t}...
-
Compute the specified ratios using Faustin Companys balance sheet for 2014. Assets Cash .............. $ 18,000 Marketable securities ......... 12,000 Accounts receivable ........ 25,000 Inventory...
-
The torque being produced by an small engine is 236.6 ft-lb while operating at 2000 RPM. The brake horsepower for that engine is?
-
The Booth Companys sales are forecasted to increase from $1,000 in 2007 to $2,000 in 2008. Here is the December 31, 2007, balance sheet: Booths fixed assets were used to only 50% of capacity during...
-
Darius (Pty) Ltd owns a small double-story building on the outskirts of a large city. The building is used for mixed purposes in that it has 4 shops on the ground floor (taxable supplies) and 2 large...
-
A document that is issued by upper management and provides the project manager with written authority to use organizational resources for project activities is called?
-
A restaurant noted what type of food its customers ordered last week. Here are the results: Find the probability that a randomly chosen customer ordered a burger given that they ordered fries.
-
7. Explain the difference between the following three C function prototypes: void f(int n); extern void f(int n); static void f(int n);
-
The information of expected returns, betas, specific standard deviations of three assets, and their proportions in a portfolio is in the following table: Assets Expected return (%) Beta Specified...
-
A common-size income statement for Creek? Enterprises' 2018 operations follows: Creek Enterprises Income Statement for the Year Ended December 31, 2018 Sales revenue ($34,966,000) 100.0 %...
-
QUESTION 7 This exercise refers to the drunk driving panel data regression, summarised in Table 10.1 on pages 31 and 32 of the Lecture 8 slides. Suppose you are interpreting the estimated coefficient...
-
The Higher the time period of the financial security the higher the. ............... risk. O a. Maturity O b. Default and Maturity Oc. Default O d. Liquidity
-
Let x be a discrete random variable that possesses a binomial distribution. Using the binomial formula, find the following probabilities. a. P(x = 5) for n = 8 and p = .70 b. P(x = 3) for n = 4 and p...
-
Refer to the probability distribution you developed in Exercise 5.16 for the number of lemons in two selected cars. Calculate the mean and standard deviation of x for that probability distribution.
-
Refer to the frequency distribution table constructed in Exercise 2.26. Prepare the cumulative frequency, cumulative relative frequency, and cumulative percentage distributions by using that table.
-
An analyst is reviewing various asset alternatives and is presented with the following information relating to the broad equity market of Switzerland and various industries within the Swiss market...
-
Identify risks faced by investors in emerging market equities over and above those that are faced by fixed-income investors in such markets.
-
Describe the main issues that arise when conducting historical analysis of real estate returns.
Study smarter with the SolutionInn App