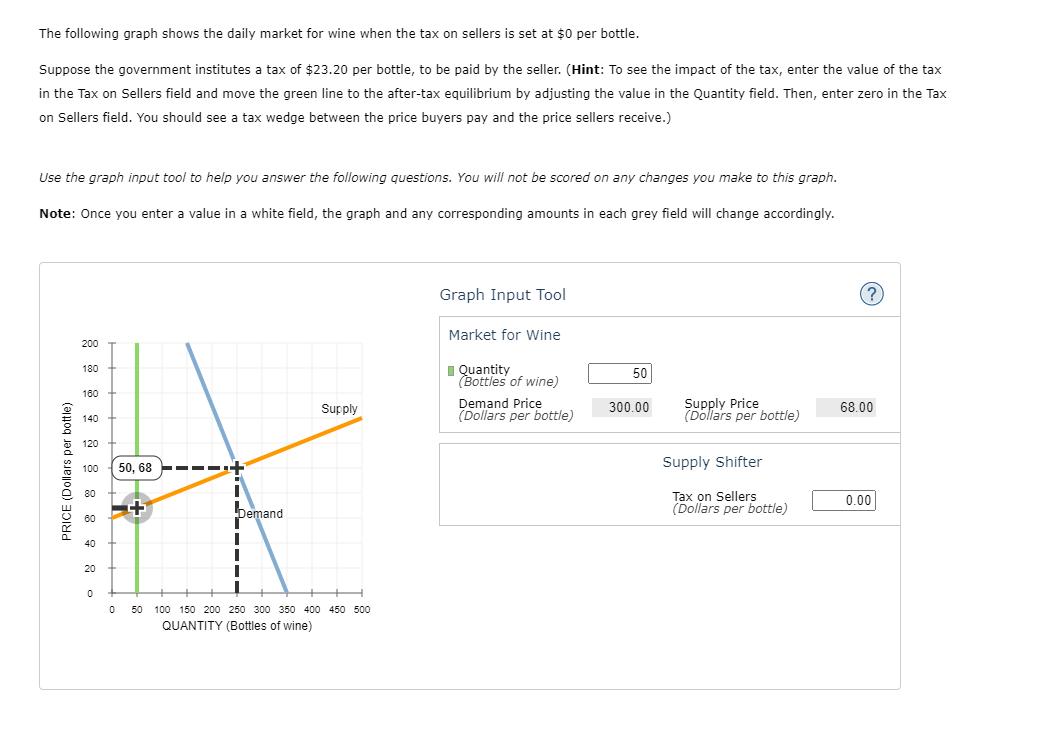
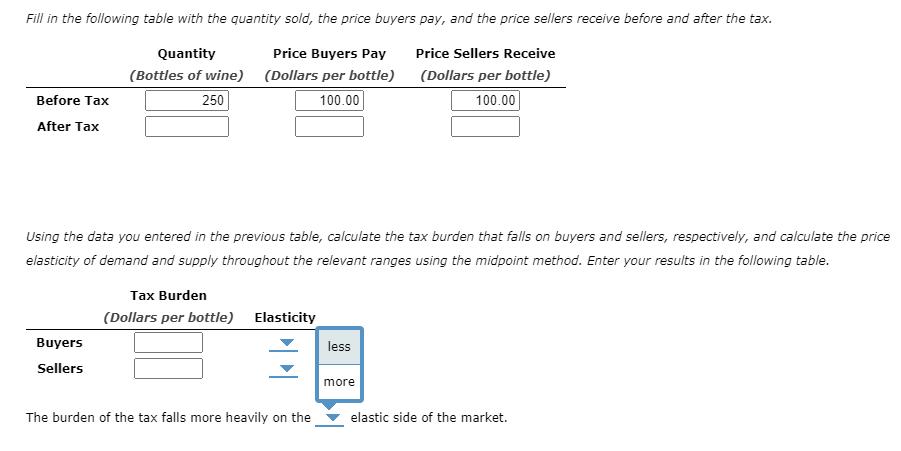
The following graph shows the daily market for wine when the tax on sellers is set...
Fantastic news! We've Found the answer you've been seeking!
Question:
Transcribed Image Text:
The following graph shows the daily market for wine when the tax on sellers is set at $0 per bottle. Suppose the government institutes a tax of $23.20 per bottle, to be paid by the seller. (Hint: To see the impact of the tax, enter the value of the tax in the Tax on Sellers field and move the green line to the after-tax equilibrium by adjusting the value in the Quantity field. Then, enter zero in the Tax on Sellers field. You should see a tax wedge between the price buyers pay and the price sellers receive.) Use the graph input tool to help you answer the following questions. You will not be scored on any changes you make to this graph. Note: Once you enter a value in a white field, the graph and any corresponding amounts in each grey field will change accordingly. Graph Input Tool (? Market for Wine 200 I Quantity (Bottles of wine) 180 50 160 Demand Price (Dollars per bottle) Supply Price (Dollars per bottle) Supply 300.00 68.00 140 120 50, 68 Shifter 100 Tax on Sellers (Dollars per bottle) 0.00 Demand 40 20 O 50 100 150 200 250 300 350 400 450 500 QUANTITY (Bottles of wine) PRICE (Dollars per bottle) Fill in the following table with the quantity sold, the price buyers pay, and the price sellers receive before and after the tax. Quantity Price Buyers Pay Price Sellers Receive (Bottles of wine) (Dollars per bottle) (Dollars per bottle) Before Tax 250 100.00 100.00 After Tax Using the data you entered in the previous table, calculate the tax burden that falls on buyers and sellers, respectively, and calculate the price elasticity of demand and supply throughout the relevant ranges using the midpoint method. Enter your results in the following table. Tax Burden (Dollars per bottle) Elasticity Buyers less Sellers more The burden of the tax falls more heavily on the elastic side of the market. The following graph shows the daily market for wine when the tax on sellers is set at $0 per bottle. Suppose the government institutes a tax of $23.20 per bottle, to be paid by the seller. (Hint: To see the impact of the tax, enter the value of the tax in the Tax on Sellers field and move the green line to the after-tax equilibrium by adjusting the value in the Quantity field. Then, enter zero in the Tax on Sellers field. You should see a tax wedge between the price buyers pay and the price sellers receive.) Use the graph input tool to help you answer the following questions. You will not be scored on any changes you make to this graph. Note: Once you enter a value in a white field, the graph and any corresponding amounts in each grey field will change accordingly. Graph Input Tool (? Market for Wine 200 I Quantity (Bottles of wine) 180 50 160 Demand Price (Dollars per bottle) Supply Price (Dollars per bottle) Supply 300.00 68.00 140 120 50, 68 Shifter 100 Tax on Sellers (Dollars per bottle) 0.00 Demand 40 20 O 50 100 150 200 250 300 350 400 450 500 QUANTITY (Bottles of wine) PRICE (Dollars per bottle) Fill in the following table with the quantity sold, the price buyers pay, and the price sellers receive before and after the tax. Quantity Price Buyers Pay Price Sellers Receive (Bottles of wine) (Dollars per bottle) (Dollars per bottle) Before Tax 250 100.00 100.00 After Tax Using the data you entered in the previous table, calculate the tax burden that falls on buyers and sellers, respectively, and calculate the price elasticity of demand and supply throughout the relevant ranges using the midpoint method. Enter your results in the following table. Tax Burden (Dollars per bottle) Elasticity Buyers less Sellers more The burden of the tax falls more heavily on the elastic side of the market.
Expert Answer:
Answer rating: 100% (QA)
Answer Solution Q Price buyer pays price seller receiv... View the full answer
Related Book For
A Survey of Mathematics with Applications
ISBN: 978-0134112107
10th edition
Authors: Allen R. Angel, Christine D. Abbott, Dennis Runde
Posted Date:
Students also viewed these economics questions
-
The following graph shows the daily market for extra-large cardboard boxes in San Diego. Suppose that Talero is one of more than a hundred competitive firms in San Diego that produce such cardboard...
-
The following graph shows the long-run average total cost curve for a perfectly competitive firm. Refer to points A, B, and C on the graph and identify where the firm would experience economies of...
-
The following graph shows three supply curves with varying degrees of price elasticity. Identify the perfectly elastic, perfectly inelastic, and unit elastic supply curves. Price Price Price Quantity...
-
What is the discount yield, bond equivalent yield, and effective annual return on a $ 5 million commercial paper issue that currently sells at 98.625 percent of its face value and is 136 days from...
-
Microsoft is a company that sells its products in many countries all over the world. Use the data from Table 11.3.18 to explore how its market price movements relate to more general movements in the...
-
A piston/cylinder has 2 kg water at 1000 kPa, 250C which is now cooled with a constant loading on the piston. This isobaric process ends when the water has reached a state of saturated liquid. Find...
-
True or False. The system stiffness matrix is always singular unless the boundary conditions are incorporated.
-
What are the objectives, inputs, and outputs of an MRP system?
-
The following information pertains to Mason Company for Year 2. Beginning inventory Units purchased 160 units @ $52 446 units @ $78 Ending inventory consisted of 64 units. Mason sold 542 units at...
-
In this exercise, you will create a payroll register for Athletics Supply House using ROUND, IF, and VLOOKUP functions. You will also modify the worksheet's layout and highlight key elements. Use...
-
What are the management benefits of supply chain management system?: How has supply chain been affected during the Covid epidemic? What have you experienced personally of this situation?
-
The Capability Maturity Model (CMM) was developed by the Software Engineering Institute at Carnegie Mellon and is widely used by both the private and public sectors. What is the purpose of the CMM...
-
List the five maturity levels, and briefly describe each of them.
-
Describe how using a systems development methodology is in line with CMM goals and can help an organization increase its maturity level.
-
Systems development methodology and system life cycle are two terms that are frequently used and just as frequently misused. What is the difference between the two terms?
-
What is the difference between scope creep and feature creep?
-
Evaluate the integral (use c for the constant of integration I 1) 2) x-2x-1 (x-1)2(x+1) dx 7x3+3x+35x +3 (x+1)(x+5) 13 3) Sx-125 dx dx ) ex (ex-7) (ex+1) dx
-
What tools are available to help shoppers compare prices, features, and values and check other shoppers opinions?
-
Determine (a) The area (b) The perimeter of the figure. 5 m 5 m 3 m 6 m 3 m
-
Find the missing value indicated by the question mark. Use the following formula. (Number of vertices) - (number of edges) + (number of faces) = 2 Number of Vertices Number of Edges Number of Faces 4...
-
Determine if the system is commutative. Explain how you determined your answer. P A P P
-
On 1 June, Sugar Rush Ltd had Accounts Receivable and Allowance for Doubtful Debts accounts as below. GST Inclusive. The following transactions occurred during the month of June: 5. Credit sales...
-
On 1 June, Cambria Financial Services Ltd had balances in the Accounts Receivable and Allowance for Doubtful Debts accounts as set out below. Ignore GST. The following transactions occurred during...
-
Outback Get Away Ltd sells four-wheel drive accessories and recovery equipment on credit. The accounting records at 30 June 2023 highlights the following. Ignore GST. In the past, the companys yearly...
Study smarter with the SolutionInn App