

The following graph shows the monthly demand and supply curves in the market for keyboards. b) The
Fantastic news! We've Found the answer you've been seeking!
Question:
The following graph shows the monthly demand and supply curves in the market for keyboards.
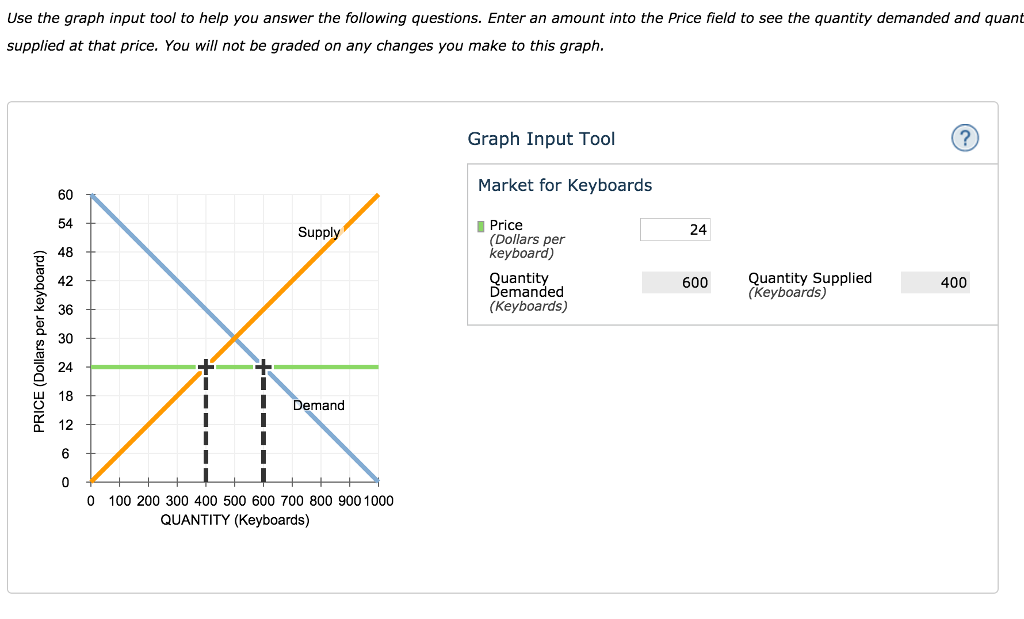 b) The equilibrium price in this market is ________ per keyboard, and the equilibrium quantity is ____________ keyboards bought and sold per month.
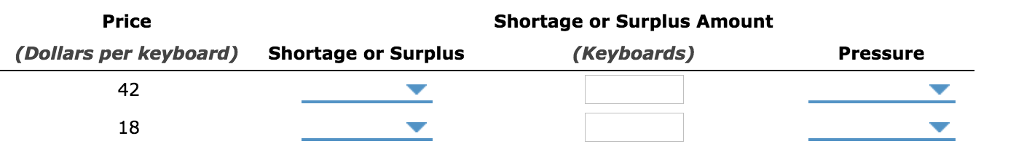
Complete the following table by indicating at each price whether there is a shortage or surplus in the market, the amount of that shortage or surplus, and whether this places upward or downward pressure on prices.
Expert Answer:

Related Book For 

Posted Date:
