

Question
The message signal m(t), whose frequency spectrum is shown in the following figure. m(t) is the input of the given block diagram where y,
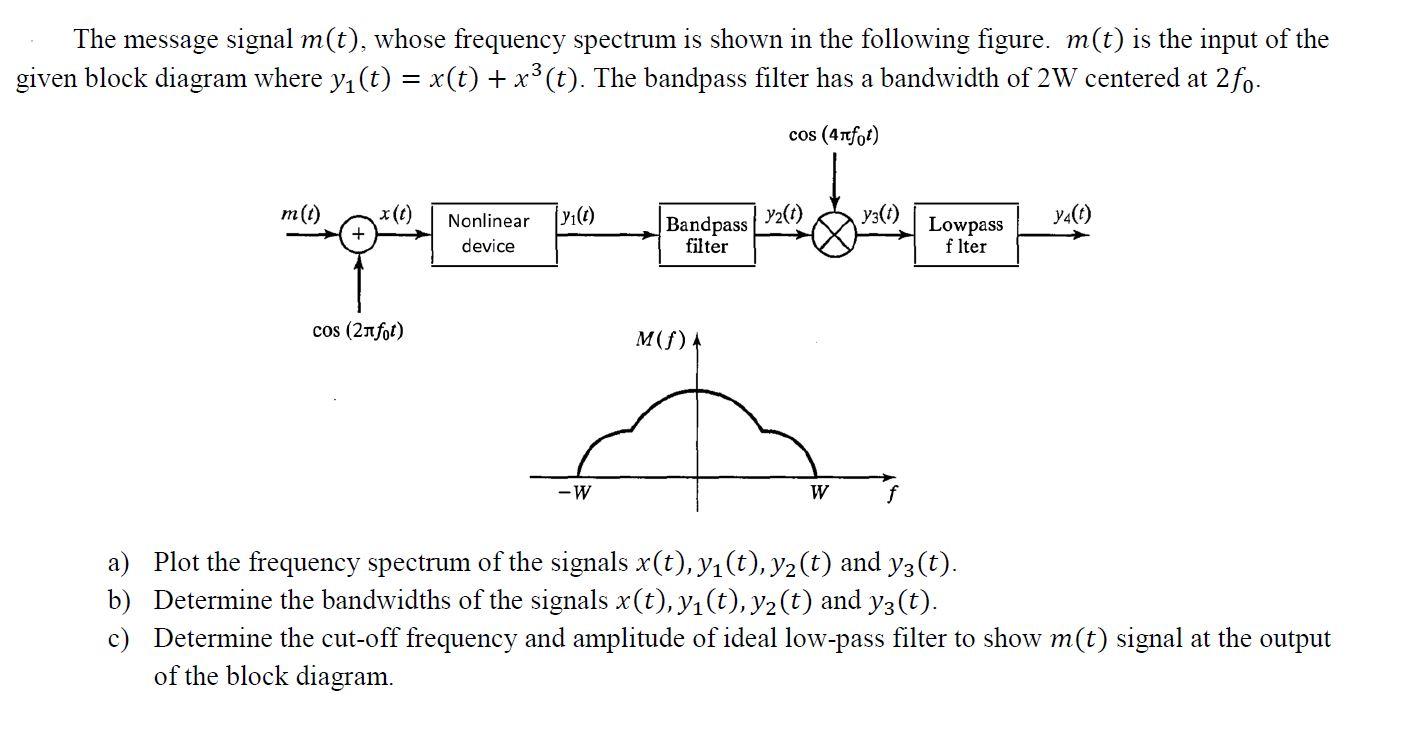
The message signal m(t), whose frequency spectrum is shown in the following figure. m(t) is the input of the given block diagram where y, (t) = x(t) + x (t). The bandpass filter has a bandwidth of 2W centered at 2fo- cos (4rfot) m(t) x(t) y2(1) Bandpass y3(1) Nonlinear Lowpass f Iter + device filter cos (2nfot) M(f)4 -W W a) Plot the frequency spectrum of the signals x(t), y1(t), y2(t) and y3(t). b) Determine the bandwidths of the signals x(t), y1(t), y2(t) and y3(t). c) Determine the cut-off frequency and amplitude of ideal low-pass filter to show m(t) signal at the output of the block diagram.
Step by Step Solution
3.24 Rating (139 Votes )
There are 3 Steps involved in it
Step: 1
c we have already de...
Get Instant Access with AI-Powered Solutions
See step-by-step solutions with expert insights and AI powered tools for academic success
Step: 2

Step: 3
Ace Your Homework with AI
Get the answers you need in no time with our AI-driven, step-by-step assistance
Get Started
Fundamentals of Engineering Economics
Authors: Chan S. Park
3rd edition
132775425, 132775427, 978-0132775427