

The numbers marked on the horizontal axis from left to right are as follows: 20, 27, 28,
Fantastic news! We've Found the answer you've been seeking!
Question:
The numbers marked on the horizontal axis from left to right are as follows: 20, 27, 28, 30 and 35. The numbers marked on the vertical axis from bottom to top are as follows: $1.00, $1.50 and $2.00. The graph shows a falling line labeled D and a rising line labeled S. The rising line begins at (27, $ 1.00), passes through (28, $ 1.50) and ends at (30, $ 2.00). The falling line begins at (20, $ 2.00), passes through (28, $1.50) and ends at (35, $1.00).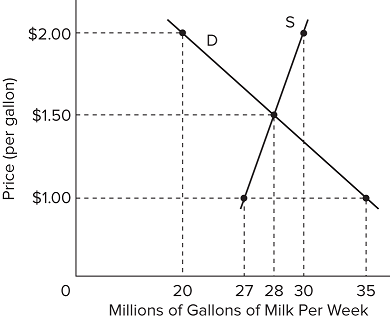
Refer to the above diagram for the milk market. If the price were $1.00 per gallon, then there would be
Â
Expert Answer:
If the price were 100 per gallon according to the graph there would be a shortage of 8 million gallons We can determine this by looking at the point where the falling line labeled D intersects the pri... View the full answer

Related Book For 

Income Tax Fundamentals 2013
ISBN: 9781285586618
31st Edition
Authors: Gerald E. Whittenburg, Martha Altus Buller, Steven L Gill
Posted Date:
