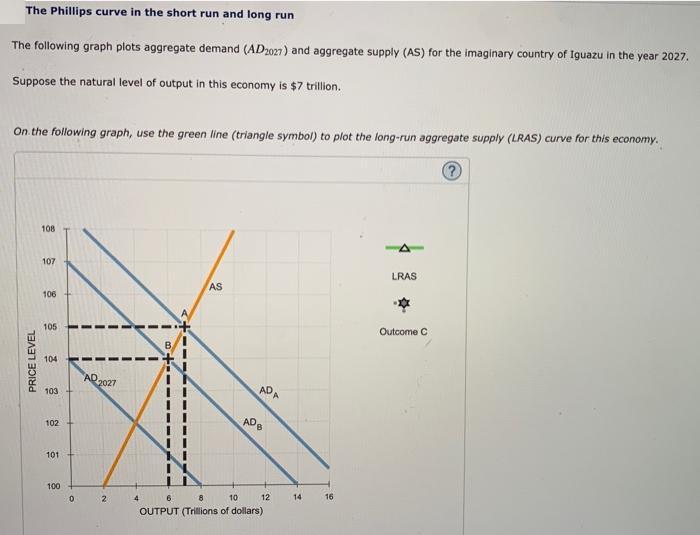
The Phillips curve in the short run and long run The following graph plots aggregate demand...
Fantastic news! We've Found the answer you've been seeking!
Question:
Transcribed Image Text:
The Phillips curve in the short run and long run The following graph plots aggregate demand (AD2027) and aggregate supply (AS) for the imaginary country of Iguazu in the year 2027. Suppose the natural level of output in this economy is $7 trillion. On the following graph, use the green line (triangle symbol) to plot the long-run aggregate supply (LRAS) curve for this economy. ? PRICE LEVEL 108 107 106 105 104 103 102 101 100 0 AD 2027 2 AS ADA ADB 4 6 8 10 OUTPUT (Trillions of dollars) 12 14 16 LRAS Outcome C Economists forecast that if the government takes no action and the economy continues to grow at the current rate, aggregate demand in 2028 will be given by the curve labeled ADA, resulting in the outcome given by point A. If, however, the government pursues a contractionary policy, aggregate demand in 2028 will be given by the curve labeled ADs, resulting in the outcome given by point B. The following table presents projections for the unemployment rates that would occur at point A and point B. Consider the potential rate of inflation between 2027 and 2028, depending on whether the economy moves from the initial price level of 102 to the price level at outcome B or the price level at outcome A. Complete the table by entering the inflation rate at each potential outcome point. Note: Calculate the inflation rate to two decimal points of precision. Unemployment Rate Inflation Rate 3% 6% A Based on your answers to the preceding parts, use the black line (plus symbol) to draw the short-run Phillips curve (SRPC) for this economy in 2028. (Note: You will not be graded on any changes you make to this graph.) INFLATION RATE (Percent) 02 A 6 10 A 32 2 1 0 2 5 6 UNEMPLOYMENT RATE (Percent) The short-run Phillips curve is 4 7 line: At the natural rate of unemployment Representing the tradeoff between unemployment and inflation At the natural level of output SRPC A LRPC (?) Now consider the long-run effects of this policy. Suppose, in particular, that following implementation of the policy, the aggregate demand curve remains at ADB. The long-run equilibrium that would follow such a policy is designated outcome C. Going back to the first graph, place the grey point (star symbol) at outcome C. Because output at point C is the natural level of output, the unemployment rate associated with outcome C is the natural rate of unemployment. Finally, use the green line (triangle symbol) to draw the long-run Phillips curve (LRPC) on the second graph. This line is line: Representing the tradeoff between unemployment and inflation At the natural level of output At the natural rate of unemployment The Phillips curve in the short run and long run The following graph plots aggregate demand (AD2027) and aggregate supply (AS) for the imaginary country of Iguazu in the year 2027. Suppose the natural level of output in this economy is $7 trillion. On the following graph, use the green line (triangle symbol) to plot the long-run aggregate supply (LRAS) curve for this economy. ? PRICE LEVEL 108 107 106 105 104 103 102 101 100 0 AD 2027 2 AS ADA ADB 4 6 8 10 OUTPUT (Trillions of dollars) 12 14 16 LRAS Outcome C Economists forecast that if the government takes no action and the economy continues to grow at the current rate, aggregate demand in 2028 will be given by the curve labeled ADA, resulting in the outcome given by point A. If, however, the government pursues a contractionary policy, aggregate demand in 2028 will be given by the curve labeled ADs, resulting in the outcome given by point B. The following table presents projections for the unemployment rates that would occur at point A and point B. Consider the potential rate of inflation between 2027 and 2028, depending on whether the economy moves from the initial price level of 102 to the price level at outcome B or the price level at outcome A. Complete the table by entering the inflation rate at each potential outcome point. Note: Calculate the inflation rate to two decimal points of precision. Unemployment Rate Inflation Rate 3% 6% A Based on your answers to the preceding parts, use the black line (plus symbol) to draw the short-run Phillips curve (SRPC) for this economy in 2028. (Note: You will not be graded on any changes you make to this graph.) INFLATION RATE (Percent) 02 A 6 10 A 32 2 1 0 2 5 6 UNEMPLOYMENT RATE (Percent) The short-run Phillips curve is 4 7 line: At the natural rate of unemployment Representing the tradeoff between unemployment and inflation At the natural level of output SRPC A LRPC (?) Now consider the long-run effects of this policy. Suppose, in particular, that following implementation of the policy, the aggregate demand curve remains at ADB. The long-run equilibrium that would follow such a policy is designated outcome C. Going back to the first graph, place the grey point (star symbol) at outcome C. Because output at point C is the natural level of output, the unemployment rate associated with outcome C is the natural rate of unemployment. Finally, use the green line (triangle symbol) to draw the long-run Phillips curve (LRPC) on the second graph. This line is line: Representing the tradeoff between unemployment and inflation At the natural level of output At the natural rate of unemployment
Expert Answer:
Related Book For
Posted Date:
Students also viewed these economics questions
-
What important trade-off occurs in the short run and what model reflects this?
-
Assume that full employment output for this economy is 2800 billion this is also called potential GDP Given your answer above by how much is the economy below full employment output
-
Given that the Phillips curve is derived from the aggregate demand and aggregate supply model, why do we use the Phillips curve analysis? What benefits does the Phillips curve analysis offer compared...
-
Over the last few years, we have started to see some retailers open earlier and earlier on Thanksgiving Day. Others have taken a different approach and decide to remain closed. Is it a good strategy...
-
New England Petroleum Corporation (NEPCO), a New York corporation, was in the business of selling fuel oil in the United States. PETCO, a refinery incorporated in the Bahamas, was a wholly owned...
-
Consider the IQ scores of professors who teach statistics courses compared with the IQ scores of adults randomly selected from the general population. Which of these two sets of IQ scores has less...
-
Leya helped at a neighborhood sale and was paid \(5 \%\) of the proceeds. If Leya is paid \(\$ 171.25\), what were the total proceeds from the neighborhood sale?
-
Waldo Corporation has recently retained your accounting firm to prepare its income tax return. Art, the partner in charge of the engagement, has assigned you the job of reviewing last years return...
-
Need help preparing the worksheet. The individual financial statements for Gibson Company and Keller Company for the year ending December 31, 2021, follow. Gibson acquired a 60 percent interest in...
-
Suppose a person has a utility function given by U = [x + y]1/ where is a number between - and 1. This is called a constant elasticity of substitution (CES) utility function. You will encounter CES...
-
Describe at least one piece of evidence that supports the theory of evolution. Alternatively, you can describe one misconception or criticism of evolution as long as you also provide a counter to...
-
1. The given data are the ratings in percent of 12 teacher applicants. 81, 70, 73, 69, 85, 78, 82, 90, 70, 84, 82, 85. Find the mean, median and mode of the given data. 2. Find the mean, median and...
-
from site https://www.subway.com/en-ca/menunutrition/menu, i have made a python program for the user to choose a menu item from two different restaurants (2 total) and make an object for each of...
-
In a triathlon, athletes swim 2.4 miles, then bike 112 miles, and finally run 26.2 miles. Jesse's average rates for each leg of a triathlon are shown in the table. Leg swim bike run Rate 4 mph 20 mph...
-
Ferris wished to execute a swap to take advantage of her expectation of a yield curve shift and believes that any difference in credit spread between LIBOR and U.S. Treasury market rates will remain...
-
Q3: Construct Influence lines of RD and MA hinge 3- m 300
-
Jack Ltd. is a manufacturer of scooter and expects to generate $165,000 of earnings before interest and taxes in perpetuity. The company distributes all its earnings as dividends at the end of each...
-
A report from the college dean indicates that for the previous semester, the grade distribution for the Department of Psychology included 135 As, 158 Bs, 140 Cs, 94 Ds, and 53 Fs. Determine what kind...
-
Answer these questions about GDP: a. How could real GDP grow, while, over the same period, real GDP per capita falls? b. If Country A has a 4 percent annual growth rate of real GDP and a 2 percent...
-
Why are repeated games more likely to be cooperative than one-shot games?
-
If the selling of kidneys were legalized, predict the impact on the market for organ transplants using supply and demand analysis. Why might the quantity supplied increase?
-
Clarkson Inc. purchased \(10 \%\) of the 10,000 shares of common stock in Nashville Inc. for \(\$ 40,000\) in January 2020. Shelton Inc. purchased 35\% of the 10,000 shares of common stock in...
-
On December 31, 2020, Raven Company's portfolio of equity securities was valued at \(\$ 1,800\). The original cost of the investments in the portfolio was \(\$ 1,600\). Raven does not have...
-
On January 1, 2020, Evergreen Inc. purchased 3,750 of the 15,000 outstanding shares of common stock of Nature Net Inc. obtaining significant influence of the company. The shares were purchased for...
Study smarter with the SolutionInn App