

The purpose of this set of exercises is to provide examples of vector equations which result...
Fantastic news! We've Found the answer you've been seeking!
Question:
Transcribed Image Text:
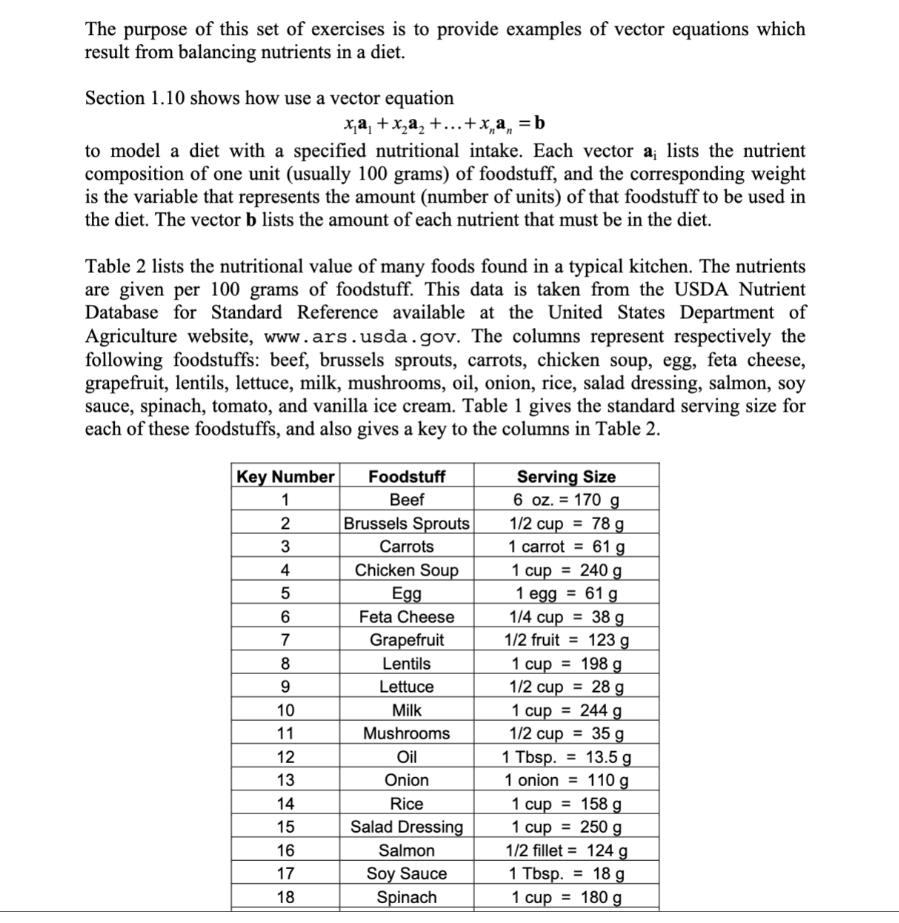
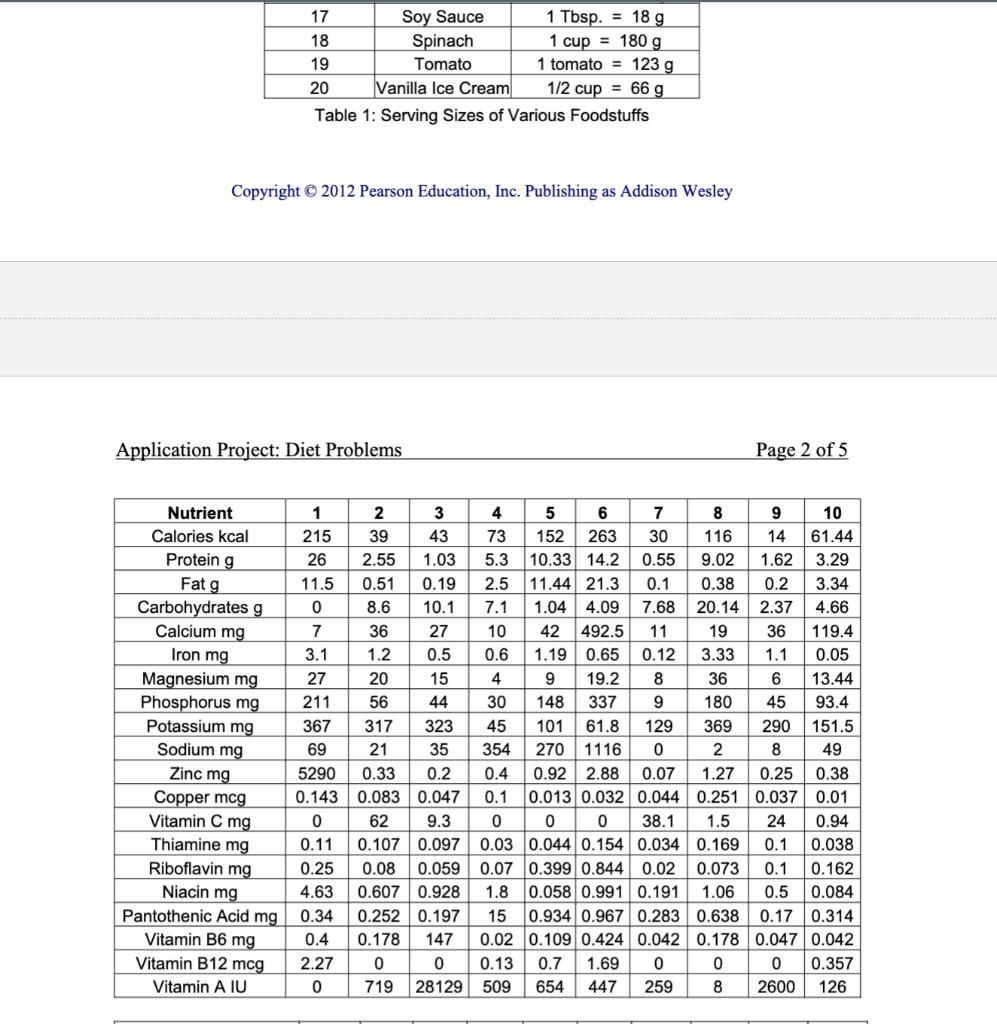
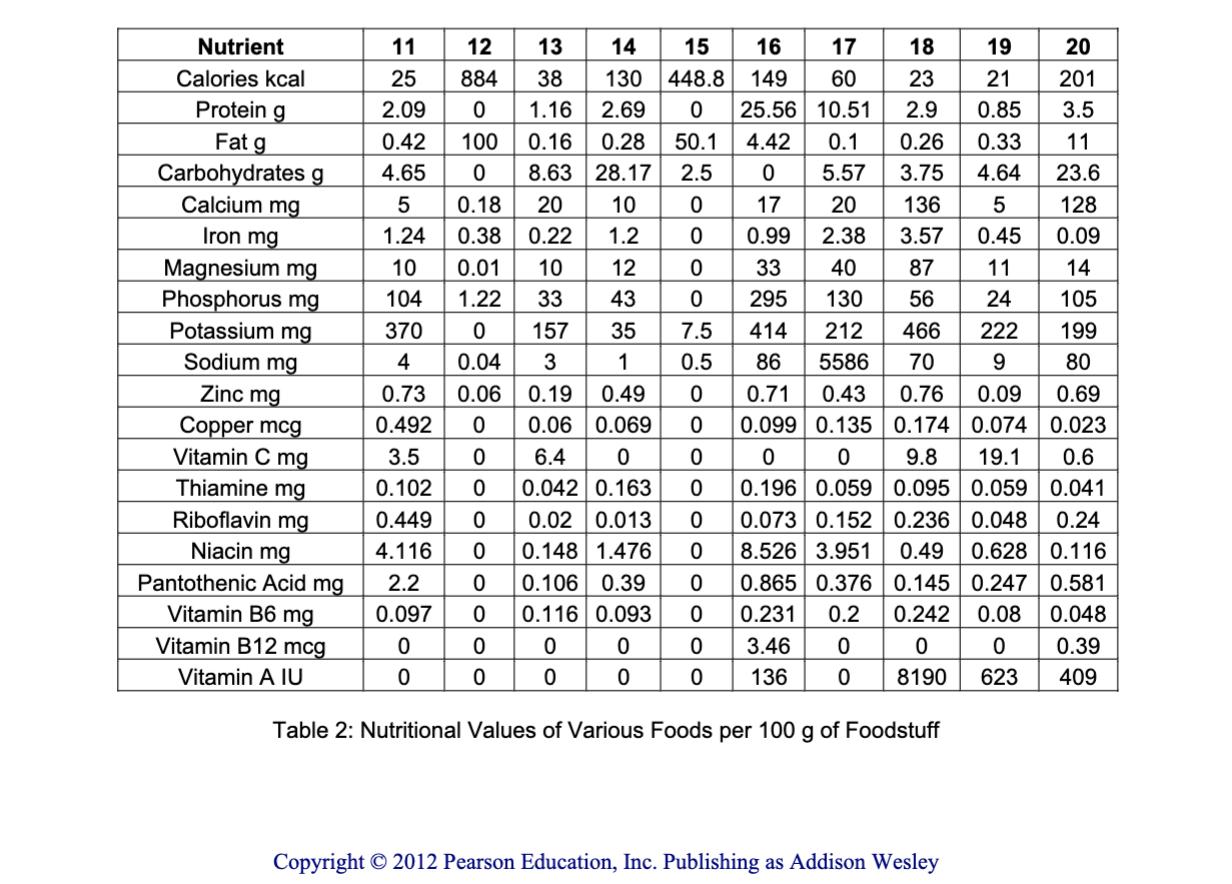
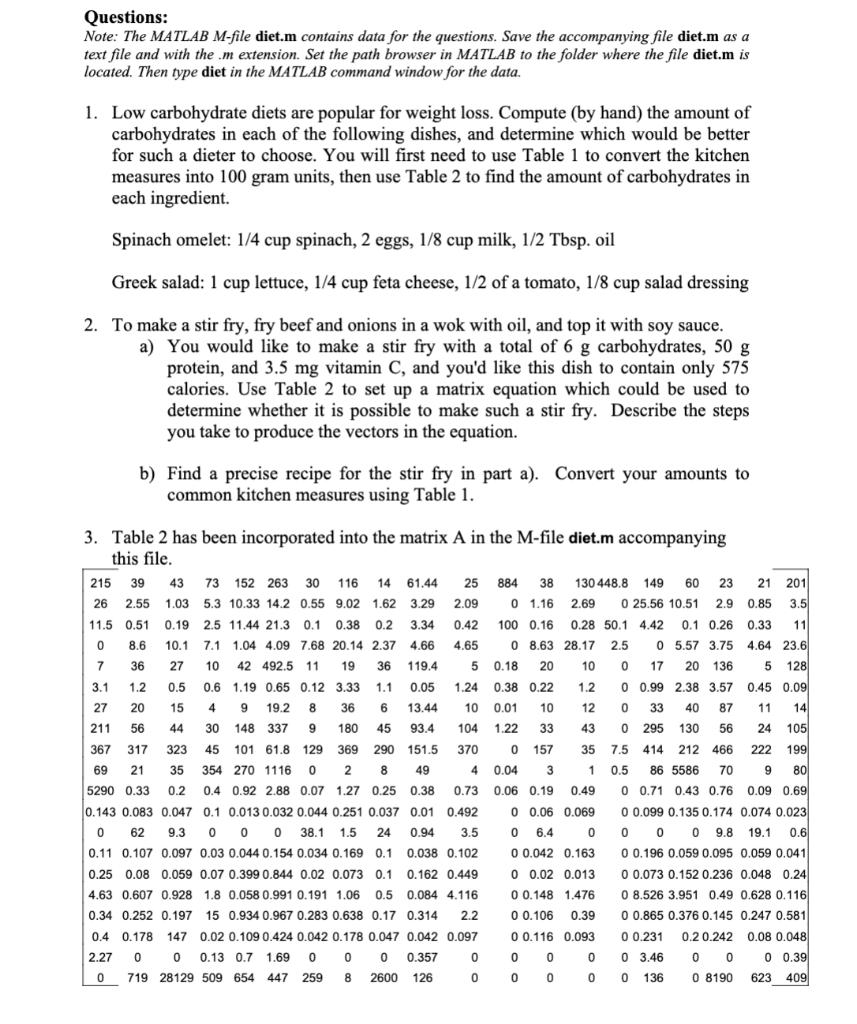
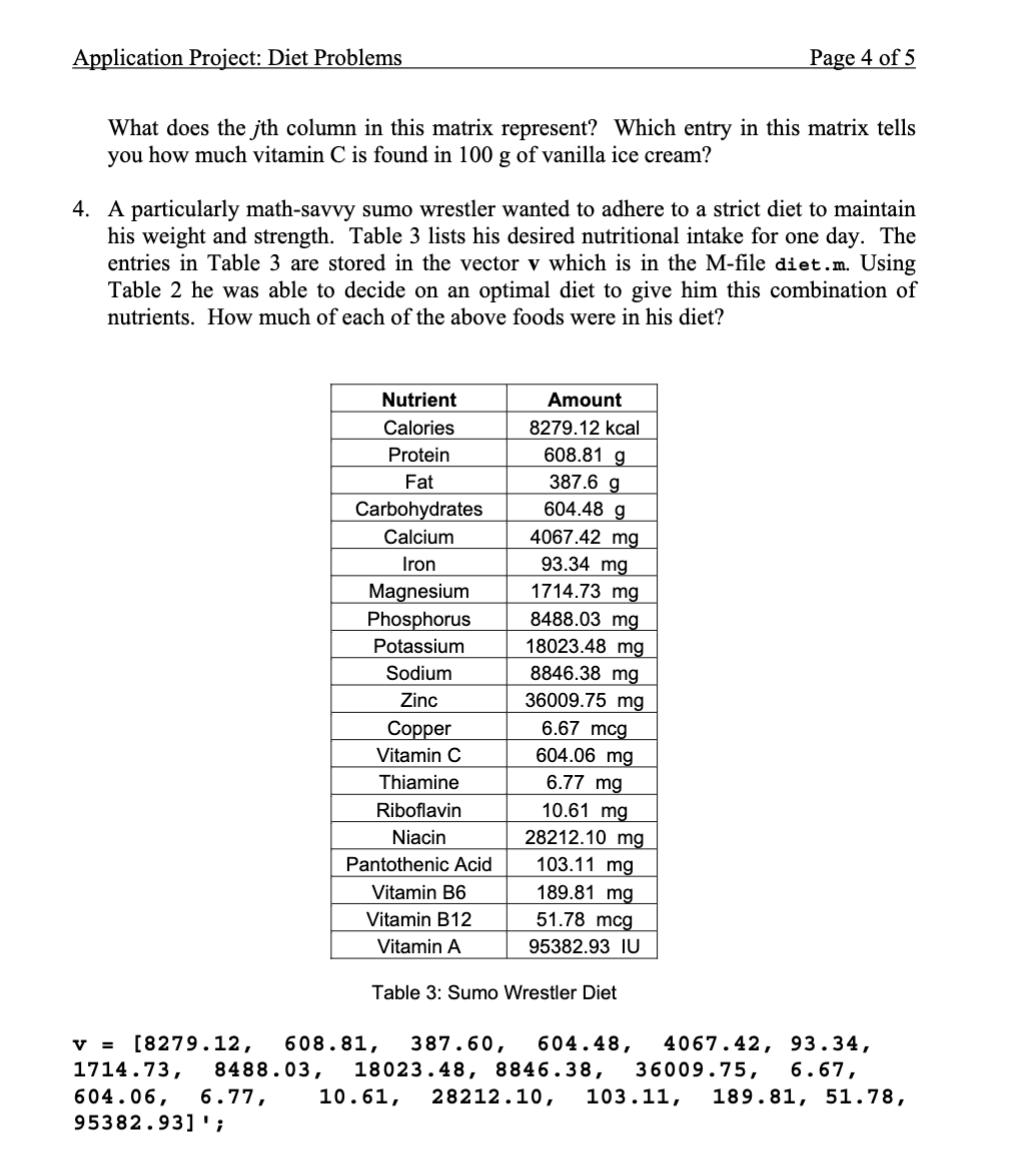
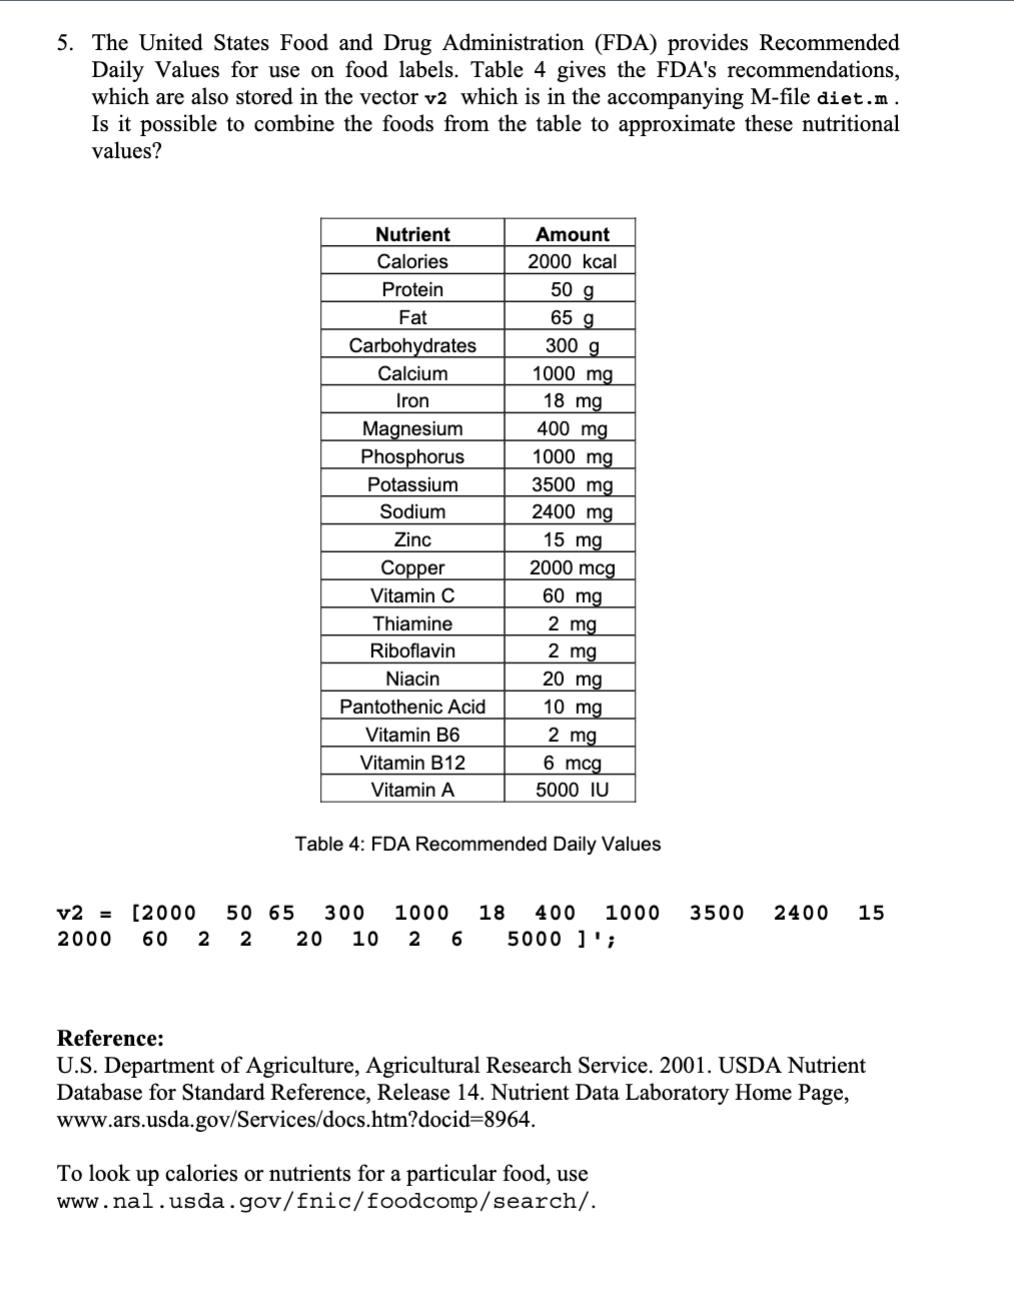
The purpose of this set of exercises is to provide examples of vector equations which result from balancing nutrients in a diet. Section 1.10 shows how use a vector equation to model a diet with a specified nutritional intake. Each vector a, lists the nutrient composition of one unit (usually 100 grams) of foodstuff, and the corresponding weight is the variable that represents the amount (number of units) of that foodstuff to be used in the diet. The vector b lists the amount of each nutrient that must be in the diet. Table 2 lists the nutritional value of many foods found in a typical kitchen. The nutrients are given per 100 grams of foodstuff. This data is taken from the USDA Nutrient Database for Standard Reference available at the United States Department of Agriculture website, www.ars.usda.gov. The columns represent respectively the following foodstuffs: beef, brussels sprouts, carrots, chicken soup, egg, feta cheese, grapefruit, lentils, lettuce, milk, mushrooms, oil, onion, rice, salad dressing, salmon, soy sauce, spinach, tomato, and vanilla ice cream. Table 1 gives the standard serving size for each of these foodstuffs, and also gives a key to the columns in Table 2. Key Number 1 2 3 456 xa, +x₂a₂+...+xa, b 7 8 9 10 11 12 13 14 15 16 17 18 Foodstuff Beef Brussels Sprouts Carrots Chicken Soup Egg Feta Cheese Grapefruit Lentils Lettuce Milk Mushrooms Oil Onion Rice Salad Dressing Salmon Soy Sauce Spinach Serving Size 6 oz. = 170 g 1/2 cup = 78 g 1 carrot 61 g 1 cup = 1 egg 1/4 cup 1/2 fruit = 240 g 61 g 1 cup = 1/2 cup 1 cup = 1/2 cup = 1 Tbsp. = 1 onion = = 38 g 123 g 198 g 28 g 244 g 35 g 13.5 g 110 g 1 cup 158 g 250 g 1 cup 1/2 fillet 124 g = 1 Tbsp. = 18 g 1 cup = 180 g Nutrient Calories kcal Protein g Fat g Carbohydrates g Calcium mg Iron mg Magnesium mg Phosphorus mg Copyright © 2012 Pearson Education, Inc. Publishing as Addison Wesley Potassium mg Sodium mg Zinc mg Copper mcg Vitamin C mg Thiamine mg 1 Tbsp. 18 g 1 cup = 180 g 1 tomato 123 g 1/2 cup = 66 g Table 1: Serving Sizes of Various Foodstuffs Application Project: Diet Problems Riboflavin mg Niacin mg 17 18 19 20 Soy Sauce Spinach Tomato Vanilla Ice Cream Pantothenic Acid mg Vitamin B6 mg Vitamin B12 mcg Vitamin A IU 2 3 39 43 2.55 1.03 0.51 0.19 8.6 10.1 1 5 6 7 8 9 14 215 152 263 30 116 10 61.44 3.29 26 10.33 14.2 9.02 1.62 11.5 2.5 0.55 11.44 21.3 0.1 1.04 4.09 7.68 0.38 0.2 3.34 0 7.1 20.14 2.37 4.66 7 36 27 10 119.4 36 1.1 3.1 1.2 0.5 0.6 0.05 27 20 15 211 56 13.44 93.4 151.5 367 69 49 0.38 0.01 42 492.5 11 19 1.19 0.65 0.12 3.33 4 9 19.2 8 36 6 44 30 148 337 9 180 45 317 323 45 101 61.8 129 369 290 21 35 354 270 1116 0 2 8 5290 0.33 0.2 0.4 0.92 2.88 0.07 1.27 0.25 0.143 0.083 0.047 0.1 0.013 0.032 0.044 0.251 0.037 0 62 9.3 0 0 0 38.1 1.5 24 0.94 0.11 0.107 0.097 0.03 0.044 0.154 0.034 0.169 0.1 0.038 0.25 0.08 0.059 0.07 0.399 0.844 0.02 0.073 0.1 0.162 4.63 0.607 0.928 1.8 0.058 0.991 0.191 1.06 0.5 0.084 0.252 0.197 15 0.934 0.967 0.283 0.638 0.17 0.314 0.178 147 0.02 0.109 0.424 0.042 0.178 0.047 0.042 0 0 0.13 0.7 1.69 0 0 0.357 719 28129 509 654 447 2600 126 0.34 0.4 2.27 0 8 0 259 4 7527 Page 2 of 5 5.3 Nutrient Calories kcal Protein g Fat g Carbohydrates g Calcium mg Iron mg Magnesium mg Phosphorus mg Potassium mg Sodium mg Zinc mg Copper mcg Vitamin C mg 11 12 13 17 18 25 23 2.09 884 0 100 14 15 16 38 130 448.8 149 60 1.16 2.69 0 25.56 10.51 0.16 0.28 50.1 4.42 0.1 0 5.57 2.9 0.85 0.42 0.26 0.33 3.75 4.65 4.64 5 0 8.63 28.17 2.5 20 0.38 0.22 0.18 10 0 17 20 136 5 1.24 1.2 0 0.99 2.38 3.57 0.45 10 0.01 10 12 0 33 40 87 11 104 1.22 33 43 295 130 56 24 370 157 35 414 212 466 222 199 4 3 1 9 80 0.73 0.06 0.19 0.49 86 5586 70 0.71 0.43 0.76 0.09 0.099 0.135 0.174 0.074 0.69 0.492 0 0.06 0.069 0.023 3.5 0 0 0 0 6.4 0 0.042 0.163 0.102 0 0.449 4.116 2.2 0.097 0 0.02 0.013 0 0.148 1.476 0 0 0.106 0.39 0 0 0.116 0.093 0 9.8 19.1 0.6 0.196 0.059 0.095 0.059 0.041 0.073 0.152 0.236 0.048 0.24 8.526 3.951 0.49 0.628 0.116 0.865 0.376 0.145 0.247 0.581 0.231 0.2 0.242 0.08 3.46 0 0 0 0.048 0 0 0 0 0.39 0 0 0 0 136 8190 623 409 Table 2: Nutritional Values of Various Foods per 100 g of Foodstuff Thiamine mg Riboflavin mg Niacin mg Pantothenic Acid mg Vitamin B6 mg Vitamin B12 mcg Vitamin A IU 0 0.04 0 0 DOR 0 7.5 0.5 ܘ ܘ ܘ ܘ Copyright © 2012 Pearson Education, Inc. Publishing as Addison Wesley 19 20 21 201 3.5 11 23.6 128 0.09 14 105 Questions: Note: The MATLAB M-file diet.m contains data for the questions. Save the accompanying file diet.m as a text file and with the .m extension. Set the path browser in MATLAB to the folder where the file diet.m is located. Then type diet in the MATLAB command window for the data. 1. Low carbohydrate diets are popular for weight loss. Compute (by hand) the amount of carbohydrates in each of the following dishes, and determine which would be better for such a dieter to choose. You will first need to use Table 1 to convert the kitchen measures into 100 gram units, then use Table 2 to find the amount of carbohydrates in each ingredient. Spinach omelet: 1/4 cup spinach, 2 eggs, 1/8 cup milk, 1/2 Tbsp. oil Greek salad: 1 cup lettuce, 1/4 cup feta cheese, 1/2 of a tomato, 1/8 cup salad dressing 2. To make a stir fry, fry beef and onions in a wok with oil, and top it with soy sauce. a) You would like to make a stir fry with a total of 6 g carbohydrates, 50 g protein, and 3.5 mg vitamin C, and you'd like this dish to contain only 575 calories. Use Table 2 to set up a matrix equation which could be used to determine whether it is possible to make such a stir fry. Describe the steps you take to produce the vectors in the equation. b) Find a precise recipe for the stir fry in part a). Convert your amounts to common kitchen measures using Table 1. 3. Table 2 has been incorporated into the matrix A in the M-file diet.m accompanying this file. 21 201 23 2.9 0.85 3.5 7 3.1 1.2 0.5 1.2 27 20 15 4 12 0 0 295 211 56 30 43 367 317 45 101 61.8 129 35 215 39 43 73 152 263 30 116 14 61.44 25 884 38 130 448.8 149 60 26 2.55 1.03 5.3 10.33 14.2 0.55 9.02 1.62 3.29 2.09 0 1.16 2.69 0 25.56 10.51 11.5 0.51 0.19 2.5 11.44 21.3 0.1 0.38 0.2 3.34 0.42 100 0.16 0.28 50.1 4.42 0.1 0.26 0.33 11 0 8.6 10.1 7.1 1.04 4.09 7.68 20.14 2.37 4.66 4.65 0 8.63 28.17 2.5 0 5.57 3.75 4.64 23.6 36 27 10 42 492.5 11 19 36 119.4 5 0.18 20 10 0 17 20 136 5 128 0.6 1.19 0.65 0.12 3.33 1.1 0.05 1.24 0.38 0.22 0 0.99 2.38 3.57 0.45 0.09 9 19.2 8 36 6 13.44 10 0.01 10 44 148 337 9 180 45 93.4 104 1.22 33 323 369 290 151.5 370 0 157 69 21 35 354 270 1116 0 2 8 49 4 0.04 3 1 5290 0.33 0.2 0.4 0.92 2.88 0.07 1.27 0.25 0.38 0.73 0.06 0.19 0.49 0.143 0.083 0.047 0.1 0.013 0.032 0.044 0.251 0.037 0.01 0.492 0 0.06 0.069 0 62 9.3 000 38.1 1.5 24 0.94 3.5 0 6.4 0.11 0.107 0.097 0.03 0.044 0.154 0.034 0.169 0.1 0.038 0.102 0 0.042 0.163 0.25 0.08 0.059 0.07 0.399 0.844 0.02 0.073 0.1 0.162 0.449 0 0.02 0.013 4.63 0.607 0.928 1.8 0.058 0.991 0.191 1.06 0.5 0.084 4.116 0 0.148 1.476 0.34 0.252 0.197 15 0.934 0.967 0.283 0.638 0.17 0.314 2.2 0 0.106 0.39 0.4 0.178 147 0.02 0.109 0.424 0.042 0.178 0.047 0.042 0.097 0 0.116 0.093 2.27 0 0 0.13 0.7 1.69 000 0.357 0 0 0 0 0 719 28129 509 654 447 259 8 2600 126 0 0 0 0 0 33 40 87 11 14 130 56 24 105 7.5 414 212 466 222 199 0.5 86 5586 70 9 80 0 0.71 0.43 0.76 0.09 0.69 0 0.099 0.135 0.174 0.074 0.023 0 0 0 9.8 19.1 0.6 0 0.196 0.059 0.095 0.059 0.041 0 0.073 0.152 0.236 0.048 0.24 0 8.526 3.951 0.49 0.628 0.116 0 0.865 0.376 0.145 0.247 0.581 0 0.231 0.20.242 0.08 0.048 0 3.46 00 0 0.39 0 136 0 8190 623 409 Application Project: Diet Problems What does the jth column in this matrix represent? Which entry in this matrix tells you how much vitamin C is found in 100 g of vanilla ice cream? 4. A particularly math-savvy sumo wrestler wanted to adhere to a strict diet to maintain his weight and strength. Table 3 lists his desired nutritional intake for one day. The entries in Table 3 are stored in the vector v which is in the M-file diet.m. Using Table 2 he was able to decide on an optimal diet to give him this combination of nutrients. How much of each of the above foods were in his diet? Nutrient Calories Protein Fat Carbohydrates Calcium Iron Magnesium Phosphorus Potassium Sodium Zinc Copper Vitamin C Thiamine Riboflavin Niacin Pantothenic Acid Vitamin B6 Vitamin B12 Vitamin A Amount 8279.12 kcal 608.81 g 387.6 g 604.48 g 4067.42 mg 93.34 mg 1714.73 mg 8488.03 mg 18023.48 mg 8846.38 mg 36009.75 mg 6.67 mcg 604.06 mg 6.77 mg 10.61 mg 28212.10 mg 103.11 mg Page 4 of 5 189.81 mg 51.78 mcg 95382.93 IU Table 3: Sumo Wrestler Diet v = [8279.12, 608.81, 387.60, 604.48, 4067.42, 93.34, 1714.73, 8488.03, 18023.48, 8846.38, 36009.75, 6.67, 604.06, 6.77, 10.61, 28212.10, 103.11, 189.81, 51.78, 95382.93]'; 5. The United States Food and Drug Administration (FDA) provides Recommended Daily Values for use on food labels. Table 4 gives the FDA's recommendations, which are also stored in the vector v2 which is in the accompanying M-file diet.m. Is it possible to combine the foods from the table to approximate these nutritional values? Nutrient Calories Protein Fat Carbohydrates Calcium Iron Magnesium Phosphorus Potassium Sodium Zinc Copper Vitamin C Thiamine Riboflavin Niacin Pantothenic Acid Vitamin B6 Vitamin B12 Vitamin A Amount 2000 kcal 50 g 65 g 300 g 1000 mg 18 mg 400 mg 1000 mg 3500 mg 2400 mg 15 mg 2000 mcg 60 mg 2 mg 2 mg 20 mg 10 mg 2 mg 6 mcg 5000 IU Table 4: FDA Recommended Daily Values v2 = [2000 50 65 300 1000 18 400 1000 3500 2400 15 20 10 2 6 5000 ]'; 2000 60 2 2 Reference: U.S. Department of Agriculture, Agricultural Research Service. 2001. USDA Nutrient Database for Standard Reference, Release 14. Nutrient Data Laboratory Home Page, www.ars.usda.gov/Services/docs.htm?docid=8964. To look up calories or nutrients for a particular food, use www.nal.usda.gov/fnic/foodcomp/search/. The purpose of this set of exercises is to provide examples of vector equations which result from balancing nutrients in a diet. Section 1.10 shows how use a vector equation to model a diet with a specified nutritional intake. Each vector a, lists the nutrient composition of one unit (usually 100 grams) of foodstuff, and the corresponding weight is the variable that represents the amount (number of units) of that foodstuff to be used in the diet. The vector b lists the amount of each nutrient that must be in the diet. Table 2 lists the nutritional value of many foods found in a typical kitchen. The nutrients are given per 100 grams of foodstuff. This data is taken from the USDA Nutrient Database for Standard Reference available at the United States Department of Agriculture website, www.ars.usda.gov. The columns represent respectively the following foodstuffs: beef, brussels sprouts, carrots, chicken soup, egg, feta cheese, grapefruit, lentils, lettuce, milk, mushrooms, oil, onion, rice, salad dressing, salmon, soy sauce, spinach, tomato, and vanilla ice cream. Table 1 gives the standard serving size for each of these foodstuffs, and also gives a key to the columns in Table 2. Key Number 1 2 3 456 xa, +x₂a₂+...+xa, b 7 8 9 10 11 12 13 14 15 16 17 18 Foodstuff Beef Brussels Sprouts Carrots Chicken Soup Egg Feta Cheese Grapefruit Lentils Lettuce Milk Mushrooms Oil Onion Rice Salad Dressing Salmon Soy Sauce Spinach Serving Size 6 oz. = 170 g 1/2 cup = 78 g 1 carrot 61 g 1 cup = 1 egg 1/4 cup 1/2 fruit = 240 g 61 g 1 cup = 1/2 cup 1 cup = 1/2 cup = 1 Tbsp. = 1 onion = = 38 g 123 g 198 g 28 g 244 g 35 g 13.5 g 110 g 1 cup 158 g 250 g 1 cup 1/2 fillet 124 g = 1 Tbsp. = 18 g 1 cup = 180 g Nutrient Calories kcal Protein g Fat g Carbohydrates g Calcium mg Iron mg Magnesium mg Phosphorus mg Copyright © 2012 Pearson Education, Inc. Publishing as Addison Wesley Potassium mg Sodium mg Zinc mg Copper mcg Vitamin C mg Thiamine mg 1 Tbsp. 18 g 1 cup = 180 g 1 tomato 123 g 1/2 cup = 66 g Table 1: Serving Sizes of Various Foodstuffs Application Project: Diet Problems Riboflavin mg Niacin mg 17 18 19 20 Soy Sauce Spinach Tomato Vanilla Ice Cream Pantothenic Acid mg Vitamin B6 mg Vitamin B12 mcg Vitamin A IU 2 3 39 43 2.55 1.03 0.51 0.19 8.6 10.1 1 5 6 7 8 9 14 215 152 263 30 116 10 61.44 3.29 26 10.33 14.2 9.02 1.62 11.5 2.5 0.55 11.44 21.3 0.1 1.04 4.09 7.68 0.38 0.2 3.34 0 7.1 20.14 2.37 4.66 7 36 27 10 119.4 36 1.1 3.1 1.2 0.5 0.6 0.05 27 20 15 211 56 13.44 93.4 151.5 367 69 49 0.38 0.01 42 492.5 11 19 1.19 0.65 0.12 3.33 4 9 19.2 8 36 6 44 30 148 337 9 180 45 317 323 45 101 61.8 129 369 290 21 35 354 270 1116 0 2 8 5290 0.33 0.2 0.4 0.92 2.88 0.07 1.27 0.25 0.143 0.083 0.047 0.1 0.013 0.032 0.044 0.251 0.037 0 62 9.3 0 0 0 38.1 1.5 24 0.94 0.11 0.107 0.097 0.03 0.044 0.154 0.034 0.169 0.1 0.038 0.25 0.08 0.059 0.07 0.399 0.844 0.02 0.073 0.1 0.162 4.63 0.607 0.928 1.8 0.058 0.991 0.191 1.06 0.5 0.084 0.252 0.197 15 0.934 0.967 0.283 0.638 0.17 0.314 0.178 147 0.02 0.109 0.424 0.042 0.178 0.047 0.042 0 0 0.13 0.7 1.69 0 0 0.357 719 28129 509 654 447 2600 126 0.34 0.4 2.27 0 8 0 259 4 7527 Page 2 of 5 5.3 Nutrient Calories kcal Protein g Fat g Carbohydrates g Calcium mg Iron mg Magnesium mg Phosphorus mg Potassium mg Sodium mg Zinc mg Copper mcg Vitamin C mg 11 12 13 17 18 25 23 2.09 884 0 100 14 15 16 38 130 448.8 149 60 1.16 2.69 0 25.56 10.51 0.16 0.28 50.1 4.42 0.1 0 5.57 2.9 0.85 0.42 0.26 0.33 3.75 4.65 4.64 5 0 8.63 28.17 2.5 20 0.38 0.22 0.18 10 0 17 20 136 5 1.24 1.2 0 0.99 2.38 3.57 0.45 10 0.01 10 12 0 33 40 87 11 104 1.22 33 43 295 130 56 24 370 157 35 414 212 466 222 199 4 3 1 9 80 0.73 0.06 0.19 0.49 86 5586 70 0.71 0.43 0.76 0.09 0.099 0.135 0.174 0.074 0.69 0.492 0 0.06 0.069 0.023 3.5 0 0 0 0 6.4 0 0.042 0.163 0.102 0 0.449 4.116 2.2 0.097 0 0.02 0.013 0 0.148 1.476 0 0 0.106 0.39 0 0 0.116 0.093 0 9.8 19.1 0.6 0.196 0.059 0.095 0.059 0.041 0.073 0.152 0.236 0.048 0.24 8.526 3.951 0.49 0.628 0.116 0.865 0.376 0.145 0.247 0.581 0.231 0.2 0.242 0.08 3.46 0 0 0 0.048 0 0 0 0 0.39 0 0 0 0 136 8190 623 409 Table 2: Nutritional Values of Various Foods per 100 g of Foodstuff Thiamine mg Riboflavin mg Niacin mg Pantothenic Acid mg Vitamin B6 mg Vitamin B12 mcg Vitamin A IU 0 0.04 0 0 DOR 0 7.5 0.5 ܘ ܘ ܘ ܘ Copyright © 2012 Pearson Education, Inc. Publishing as Addison Wesley 19 20 21 201 3.5 11 23.6 128 0.09 14 105 Questions: Note: The MATLAB M-file diet.m contains data for the questions. Save the accompanying file diet.m as a text file and with the .m extension. Set the path browser in MATLAB to the folder where the file diet.m is located. Then type diet in the MATLAB command window for the data. 1. Low carbohydrate diets are popular for weight loss. Compute (by hand) the amount of carbohydrates in each of the following dishes, and determine which would be better for such a dieter to choose. You will first need to use Table 1 to convert the kitchen measures into 100 gram units, then use Table 2 to find the amount of carbohydrates in each ingredient. Spinach omelet: 1/4 cup spinach, 2 eggs, 1/8 cup milk, 1/2 Tbsp. oil Greek salad: 1 cup lettuce, 1/4 cup feta cheese, 1/2 of a tomato, 1/8 cup salad dressing 2. To make a stir fry, fry beef and onions in a wok with oil, and top it with soy sauce. a) You would like to make a stir fry with a total of 6 g carbohydrates, 50 g protein, and 3.5 mg vitamin C, and you'd like this dish to contain only 575 calories. Use Table 2 to set up a matrix equation which could be used to determine whether it is possible to make such a stir fry. Describe the steps you take to produce the vectors in the equation. b) Find a precise recipe for the stir fry in part a). Convert your amounts to common kitchen measures using Table 1. 3. Table 2 has been incorporated into the matrix A in the M-file diet.m accompanying this file. 21 201 23 2.9 0.85 3.5 7 3.1 1.2 0.5 1.2 27 20 15 4 12 0 0 295 211 56 30 43 367 317 45 101 61.8 129 35 215 39 43 73 152 263 30 116 14 61.44 25 884 38 130 448.8 149 60 26 2.55 1.03 5.3 10.33 14.2 0.55 9.02 1.62 3.29 2.09 0 1.16 2.69 0 25.56 10.51 11.5 0.51 0.19 2.5 11.44 21.3 0.1 0.38 0.2 3.34 0.42 100 0.16 0.28 50.1 4.42 0.1 0.26 0.33 11 0 8.6 10.1 7.1 1.04 4.09 7.68 20.14 2.37 4.66 4.65 0 8.63 28.17 2.5 0 5.57 3.75 4.64 23.6 36 27 10 42 492.5 11 19 36 119.4 5 0.18 20 10 0 17 20 136 5 128 0.6 1.19 0.65 0.12 3.33 1.1 0.05 1.24 0.38 0.22 0 0.99 2.38 3.57 0.45 0.09 9 19.2 8 36 6 13.44 10 0.01 10 44 148 337 9 180 45 93.4 104 1.22 33 323 369 290 151.5 370 0 157 69 21 35 354 270 1116 0 2 8 49 4 0.04 3 1 5290 0.33 0.2 0.4 0.92 2.88 0.07 1.27 0.25 0.38 0.73 0.06 0.19 0.49 0.143 0.083 0.047 0.1 0.013 0.032 0.044 0.251 0.037 0.01 0.492 0 0.06 0.069 0 62 9.3 000 38.1 1.5 24 0.94 3.5 0 6.4 0.11 0.107 0.097 0.03 0.044 0.154 0.034 0.169 0.1 0.038 0.102 0 0.042 0.163 0.25 0.08 0.059 0.07 0.399 0.844 0.02 0.073 0.1 0.162 0.449 0 0.02 0.013 4.63 0.607 0.928 1.8 0.058 0.991 0.191 1.06 0.5 0.084 4.116 0 0.148 1.476 0.34 0.252 0.197 15 0.934 0.967 0.283 0.638 0.17 0.314 2.2 0 0.106 0.39 0.4 0.178 147 0.02 0.109 0.424 0.042 0.178 0.047 0.042 0.097 0 0.116 0.093 2.27 0 0 0.13 0.7 1.69 000 0.357 0 0 0 0 0 719 28129 509 654 447 259 8 2600 126 0 0 0 0 0 33 40 87 11 14 130 56 24 105 7.5 414 212 466 222 199 0.5 86 5586 70 9 80 0 0.71 0.43 0.76 0.09 0.69 0 0.099 0.135 0.174 0.074 0.023 0 0 0 9.8 19.1 0.6 0 0.196 0.059 0.095 0.059 0.041 0 0.073 0.152 0.236 0.048 0.24 0 8.526 3.951 0.49 0.628 0.116 0 0.865 0.376 0.145 0.247 0.581 0 0.231 0.20.242 0.08 0.048 0 3.46 00 0 0.39 0 136 0 8190 623 409 Application Project: Diet Problems What does the jth column in this matrix represent? Which entry in this matrix tells you how much vitamin C is found in 100 g of vanilla ice cream? 4. A particularly math-savvy sumo wrestler wanted to adhere to a strict diet to maintain his weight and strength. Table 3 lists his desired nutritional intake for one day. The entries in Table 3 are stored in the vector v which is in the M-file diet.m. Using Table 2 he was able to decide on an optimal diet to give him this combination of nutrients. How much of each of the above foods were in his diet? Nutrient Calories Protein Fat Carbohydrates Calcium Iron Magnesium Phosphorus Potassium Sodium Zinc Copper Vitamin C Thiamine Riboflavin Niacin Pantothenic Acid Vitamin B6 Vitamin B12 Vitamin A Amount 8279.12 kcal 608.81 g 387.6 g 604.48 g 4067.42 mg 93.34 mg 1714.73 mg 8488.03 mg 18023.48 mg 8846.38 mg 36009.75 mg 6.67 mcg 604.06 mg 6.77 mg 10.61 mg 28212.10 mg 103.11 mg Page 4 of 5 189.81 mg 51.78 mcg 95382.93 IU Table 3: Sumo Wrestler Diet v = [8279.12, 608.81, 387.60, 604.48, 4067.42, 93.34, 1714.73, 8488.03, 18023.48, 8846.38, 36009.75, 6.67, 604.06, 6.77, 10.61, 28212.10, 103.11, 189.81, 51.78, 95382.93]'; 5. The United States Food and Drug Administration (FDA) provides Recommended Daily Values for use on food labels. Table 4 gives the FDA's recommendations, which are also stored in the vector v2 which is in the accompanying M-file diet.m. Is it possible to combine the foods from the table to approximate these nutritional values? Nutrient Calories Protein Fat Carbohydrates Calcium Iron Magnesium Phosphorus Potassium Sodium Zinc Copper Vitamin C Thiamine Riboflavin Niacin Pantothenic Acid Vitamin B6 Vitamin B12 Vitamin A Amount 2000 kcal 50 g 65 g 300 g 1000 mg 18 mg 400 mg 1000 mg 3500 mg 2400 mg 15 mg 2000 mcg 60 mg 2 mg 2 mg 20 mg 10 mg 2 mg 6 mcg 5000 IU Table 4: FDA Recommended Daily Values v2 = [2000 50 65 300 1000 18 400 1000 3500 2400 15 20 10 2 6 5000 ]'; 2000 60 2 2 Reference: U.S. Department of Agriculture, Agricultural Research Service. 2001. USDA Nutrient Database for Standard Reference, Release 14. Nutrient Data Laboratory Home Page, www.ars.usda.gov/Services/docs.htm?docid=8964. To look up calories or nutrients for a particular food, use www.nal.usda.gov/fnic/foodcomp/search/.
Expert Answer:
Answer rating: 100% (QA)
a Setting up a matrix equation for the stir fry Create a vector x to represent the amount in grams of each food ingredient x1 grams of beef x2 grams o... View the full answer

Related Book For 

Posted Date:
Students also viewed these mathematics questions
-
Write a literature review for your study. See below for an example of a literature review. Your literature review should provide both analysis and synthesis of previous studies as related to the...
-
Write a project management plan. we have a template and project description. we need to edit the template(table of contents) with our own ideas. CPSC 8820-01 Project Management Plan Your Unique...
-
The purpose of this mini-project is to help you verify the Rule for Sample Means, using a physical simulation. Suppose you are interested in measuring the average amount of blood contained in the...
-
In the OKR goal-setting framework, what is the difference between objectives and key results? Objectives deal with measurable aspects of a company's processes, while key results deal with...
-
Use nodal analysis to find V0 in the circuit infigure. 2mA 1kO 1k? 1k2 2k2 12V( Vo
-
State the major changes which have occurred in auditing techniques during the last 160 years. Explain briefly how changes in technology have impacted on the changes in auditing techniques.
-
The following information was taken from the records of Mobile Motorsports, Ince, at September 30, 2008. Requirement Prepare a multistep income statement for Mobile Motorsports, Inc., for the fiscal...
-
According to Salary Wizard, the average base salary for a brand manager in Houston, Texas, is $88,592 and the average base salary for a brand manager in Los Angeles, California, is $97,417 (Salary...
-
RLC LiRLC Limited had a large allowable capital loss of $77,625 on one transaction during its current taxation year ended December 31. In addition, the following information pertains to its situation...
-
Create a detailed diagram of all the stakeholders of Willow Springs. How is each of the stakeholders affected by the water parks actions? What conclusions can you draw from this analysis? Explain.
-
In what ways do the complexities of interdepartmental dependencies and cross-functional collaborations hinder the seamless integration of innovative approaches and disrupt the status quo, engendering...
-
In terms of conflict dialogue, describe any ways you think your culture might be misunderstood by other cultures.
-
Mahon Corporation has two production departments, Casting and Customizing. The company uses a job-order costing system and computes a predetermined overhead rate in each production department. The...
-
1.What type of target marketing do you think Minneapolis Sculpture garden is using to attract people to the garden? Differentiated, undifferentiated, or concentrated?
-
The altitude of a triangle is increasing at a rate of 1.5 centimeters/minute while the area of the triangle is increasing at a rate of 1 square centimeters/minute. At what rate is the base of the...
-
What do you think about CEO Jeff Bezos' controversial approach to starting Amazon.com?What was the approach successful?
-
Find the APR, or stated rate, in each of the following cases: (Do not round intermediate calculations and enter your answers as a percent rounded to 2 decimal places, e.g., 32.16.) Stated Rate (APR)...
-
Wimot Trucking Corporation uses the units-of-production depreciation method because units-of-production best measures wear and tear on the trucks. Consider these facts about one Mack truck in the...
-
The students surveyed for the data on exercising in Example 7.4 were also asked How many alcoholic beverages do you consume in a typical week? Five-number summaries for males and females responses...
-
An article in the Los Angeles Times (24 December 1994, p. A16) announced that a new test for detecting HIV had been approved by the Food and Drug Administration (FDA). The test requires the person to...
-
Refer to the scenarios in Table 16.1 on page 347. Suppose someone stands to gain $ 100,000 in a lawsuit, but there is a 5% chance that something will go wrong and they will get nothing. They are...
-
Use Lagrange's equation to derive the equation of motion for the simple pendulum of Example 4.15, except here assume that the mass \(m\) is suspended on a rigid bar that is connected to the support...
-
Resolve Problem 19 including damping. Discuss the importance of damping by comparing the two results. Problem 19: Structures are sometimes subjected to very rapidly applied loads of extremely short...
-
Solve for the response for all time of an underdamped oscillator that is driven by the forcing function shown in (a) Figure 4.34, and (b) Figure 4.35. Use the convolution integral. -2.0 -1.5 -1.0 1...

Study smarter with the SolutionInn App