

The spreadsheet Group Report Data.xlsx contains monthly returns on ten Australian industry indices from January 2016...
Fantastic news! We've Found the answer you've been seeking!
Question:
Transcribed Image Text:
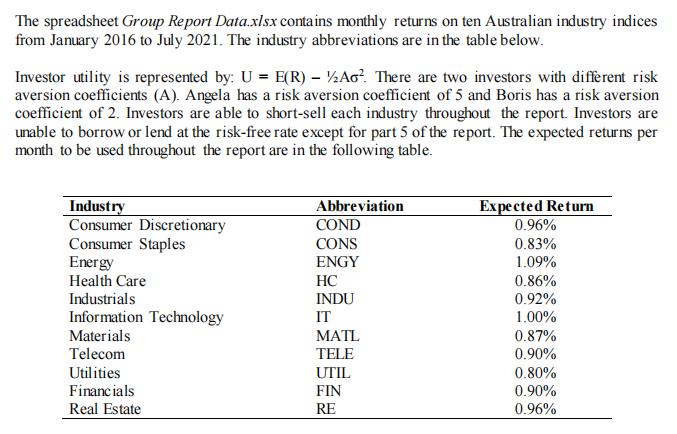
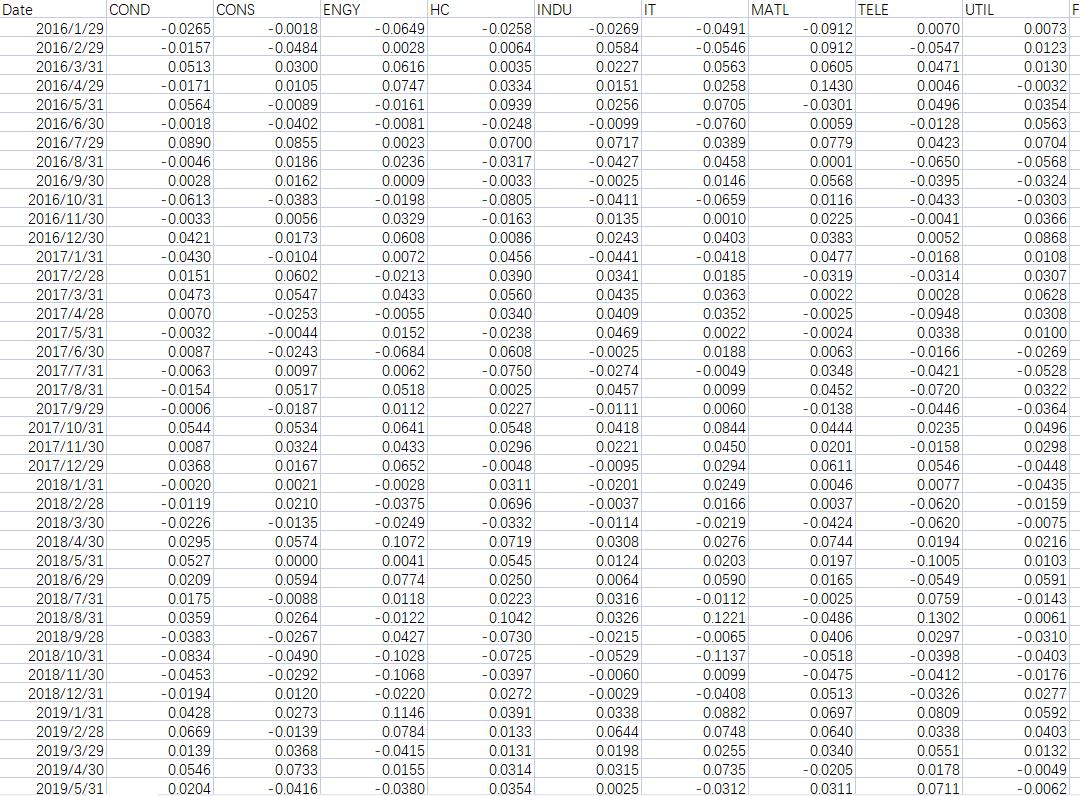
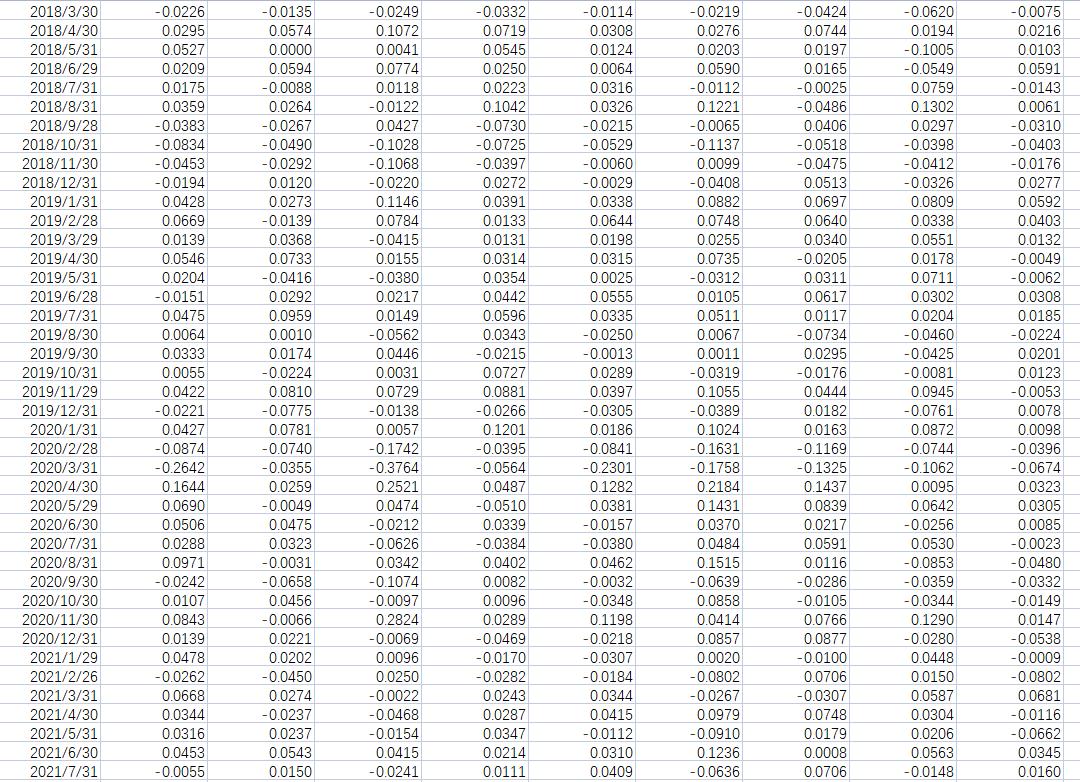
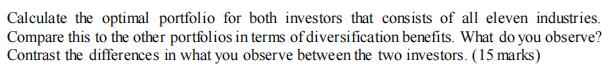
The spreadsheet Group Report Data.xlsx contains monthly returns on ten Australian industry indices from January 2016 to July 2021. The industry abbreviations are in the table below. Investor utility is represented by: U = E(R) – ½Ao?. There are two investors with diffèrent risk aversion coefficients (A). Angela has a risk aversion coefficient of 5 and Boris has a risk aversion coefficient of 2. Investors are able to short-sell each industry throughout the report. Investors are unable to borrow or lend at the risk-free rate except for part 5 of the report. The expected returns per month to be used throughout the report are in the following table. Industry Consumer Discretionary Consumer Staples Energy Abbreviation COND Expected Return 0.96% CONS 0.83% ENGY 1.09% Health Care HC 0.86% Industrials INDU 0.92% Information Technology IT 1.00% Materials МATL 0.87% 0.90% Telecom TELE Utilities UTIL 0.80% Financials FIN 0.90% Real Estate RE 0.96% Date COND CONS ENGY HC INDU IT MATL TELE UTIL -0.0018 -0.0649 -0.0912 0.0073 0.0123 2016/1/29 -0.0265 -0.0258 -0.0269 -0.0491 0.0070 2016/2/29 -0.0157 -0.0484 0.0028 0.0064 0.0584 -0.0546 0.0912 -0.0547 2016/3/31 0.0513 0.0300 0.0616 0.0035 0.0227 0.0563 0.0605 0.0471 0.0130 0.0747 0.0151 0.0256 2016/4/29 -0.0171 0.0105 0.0334 0.0258 0.1430 0.0046 -0.0032 2016/5/31 0.0564 -0.0089 -0.0161 0.0939 0.0705 -0.0301 0.0496 0.0354 2016/6/30 -0.0018 -0.0402 -0.0081 -0.0248 -0.0099 -0.0760 0.0059 -0.0128 0.0563 2016/7/29 0.0890 0.0855 0.0023 0.0700 0.0717 0.0389 0.0779 0.0423 0.0704 -0.0046 -0.0317 -0.0427 -0.0025 2016/8/31 0.0186 0.0236 0.0458 0.0001 -0.0650 -0.0568 0.0028 -0.0613 0.0009 0.0568 0.0116 2016/9/30 0.0162 -0.0033 0.0146 -0.0395 -0.0324 -0.0303 0.0366 -0.0383 -0.0198 -0.0805 -0.0163 2016/10/31 -0.0411 -0.0659 -0.0433 -0.0033 0.0421 -0.0430 2016/11/30 0.0135 0.0243 0.0056 0.0329 0.0010 0.0225 -0.0041 2016/12/30 0.0173 0.0608 0.0086 0.0403 0.0383 0.0052 0.0868 0.0456 0.0477 -0.0319 2017/1/31 -0.0104 0.0072 -0.0441 -0.0418 -0.0168 0.0108 0.0307 -0.0314 0.0028 0.0151 0.0341 0.0435 2017/2/28 0.0602 -0.0213 0.0390 0.0185 2017/3/31 0.0473 0.0547 0.0433 0.0560 0.0363 0.0022 0.0628 2017/4/28 0.0070 -0.0253 -0.0055 0.0340 0.0409 0.0352 -0.0025 -0.0948 0.0308 0.0152 -0.0684 2017/5/31 -0.0032 -0.0044 -0.0238 0.0469 0.0022 -0.0024 0.0338 0.0100 2017/6/30 0.0087 -0.0243 0.0063 -0.0269 0.0608 -0.0750 -0.0025 0.0188 -0.0166 2017/7/31 -0.0063 0.0097 0.0062 -0.0274 -0.0049 0.0348 -0.0421 -0.0528 0.0518 0.0099 0.0457 -0.0111 2017/8/31 -0.0154 0.0517 0.0025 0.0452 -0.0720 0.0322 2017/9/29 0.0060 -0.0138 0.0444 -0.0446 -0.0006 0.0544 0.0087 -0.0187 0.0112 0.0227 -0.0364 2017/10/31 0.0534 0.0641 0.0548 0.0418 0.0844 0.0235 0.0496 2017/11/30 0.0324 0.0433 0.0296 0.0221 0.0450 0.0201 -0.0158 0.0298 2017/12/29 0.0368 0.0167 0.0021 0.0210 0.0652 -0.0048 -0.0095 0.0294 0.0611 0.0546 -0.0448 -0.0020 -0.0119 2018/1/31 -0.0028 0.0311 -0.0201 0.0249 0.0046 0.0077 -0.0435 2018/2/28 -0.0375 0.0696 -0.0037 0.0166 0.0037 -0.0620 -0.0159 -0.0620 -0.0114 0.0308 0.0124 -0.0424 0.0744 2018/3/30 -0.0226 -0.0135 -0.0249 -0.0332 -0.0219 -0.0075 0.1072 0.0041 0.0295 0.0574 0.0719 0.0545 2018/4/30 0.0276 0.0194 0.0216 0.0527 0.0209 0.0197 0.0165 2018/5/31 0.0000 0.0203 -0.1005 0.0103 0.0591 -0.0143 0.0061 2018/6/29 0.0594 0.0774 0.0250 0.0064 0.0590 -0.0549 0.0759 0.0175 0.0359 2018/7/31 -0.0088 0.0118 0.0223 0.0316 -0.0112 -0.0025 2018/8/31 0.0264 -0.0122 0.1042 0.0326 0.1221 -0.0486 0.1302 2018/9/28 -0.0383 -0.0267 0.0427 -0.0730 -0.0215 -0.0065 0.0406 0.0297 -0.0310 -0.0834 -0.1028 -0.0529 -0.1137 0.0099 2018/10/31 -0.0490 -0.0725 -0.0518 -0.0398 -0.0403 2018/11/30 -0.0453 -0.0292 -0.1068 -0.0397 -0.0060 -0.0475 -0.0412 -0.0176 2018/12/31 -0.0194 0.0120 -0.0220 0.0272 0.0513 -0.0326 -0.0029 0.0338 -0.0408 0.0277 2019/1/31 0.0428 0.0273 0.1146 0.0391 0.0882 0.0697 0.0809 0.0592 0.0644 0.0198 0.0403 0.0669 0.0139 2019/2/28 -0.0139 0.0784 0.0133 0.0748 0.0640 0.0338 2019/3/29 0.0368 -0.0415 0.0131 0.0255 0.0340 0.0551 0.0132 2019/4/30 0.0546 0.0733 0.0155 0.0314 0.0315 0.0735 -0.0205 0.0178 -0.0049 2019/5/31 0.0204 -0.0416 -0.0380 0.0354 0.0025 -0.0312 0.0311 0.0711 -0.0062 -0.0332 -0.0620 -0.0135 0.0574 -0.0424 0.0744 0.0197 2018/3/30 -0.0226 -0.0249 -0.0114 -0.0219 -0.0075 0.0719 0.0194 -0.1005 2018/4/30 0.0295 0.1072 0.0308 0.0276 0.0216 2018/5/31 0.0527 0.0000 0.0041 0.0545 0.0124 0.0203 0.0103 0.0774 0.0118 0.0250 0.0064 0.0165 -0.0025 -0.0486 2018/6/29 0.0209 0.0594 0.0590 -0.0549 0.0591 2018/7/31 2018/8/31 0.0175 -0.0112 0.1221 -0.0088 0.0223 0.0316 0.0759 -0.0143 0.0359 0.0264 -0.0122 0.1042 0.0326 0.1302 0.0061 2018/9/28 -0.0383 -0.0267 0.0427 -0.0730 -0.0215 -0.0065 0.0406 0.0297 -0.0310 2018/10/31 -0.0834 -0.0490 -0.1028 -0.0725 -0.0529 -0.1137 -0.0518 -0.0398 -0.0403 2018/11/30 -0.0453 -0.0292 -0.1068 -0.0397 -0.0060 0.0099 -0.0475 -0.0412 -0.0176 2018/12/31 0.0120 -0.0220 -0.0029 0.0338 0.0644 -0.0194 0.0272 -0.0408 0.0513 -0.0326 0.0277 0.1146 0.0784 2019/1/31 0.0428 0.0273 0.0391 0.0882 0.0697 0.0809 0.0592 2019/2/28 0.0669 -0.0139 0.0133 0.0748 0.0640 0.0338 0.0403 2019/3/29 0.0139 0.0255 0.0340 0.0132 0.0368 0.0733 -0.0415 0.0131 0.0198 0.0551 2019/4/30 0.0546 0.0155 0.0314 0.0315 0.0735 -0.0205 0.0178 -0.0049 2019/5/31 0.0204 -0.0416 0.0292 -0.0380 0.0354 0.0025 -0.0312 0.0711 -0.0062 0.0311 0.0617 0.0442 0.0596 2019/6/28 -0.0151 0.0217 0.0555 0.0105 0.0302 0.0308 0.0204 -0.0460 2019/7/31 0.0475 0.0959 0.0149 0.0335 0.0511 0.0117 0.0185 2019/8/30 0.0064 0.0010 -0.0562 0.0343 -0.0250 0.0067 -0.0734 -0.0224 2019/9/30 0.0333 0.0174 0.0446 -0.0215 -0.0013 0.0011 0.0295 -0.0425 0.0201 2019/10/31 0.0055 -0.0224 0.0031 0.0727 0.0289 -0.0319 -0.0176 -0.0081 0.0123 0.1055 -0.0389 2019/11/29 0.0422 0.0810 0.0729 0.0881 0.0397 0.0444 0.0945 -0.0053 2019/12/31 -0.0221 -0.0775 -0.0138 -0.0266 -0.0305 0.0182 -0.0761 0.0078 2020/1/31 0.0427 0.0781 0.0057 0.1201 0.0186 0.1024 0.0163 0.0872 0.0098 -0.0874 -0.2642 0.1644 -0.0740 -0.0355 0.0259 -0.1742 -0.3764 0.2521 -0.0395 -0.0564 -0.0744 -0.1062 -0.0841 -0.1631 -0.1169 -0.1325 2020/2/28 -0.0396 -0.0674 0.0323 2020/3/31 -0.2301 -0.1758 2020/4/30 0.0487 0.1282 0.2184 0.1437 0.0095 0.0642 -0.0256 2020/5/29 0.0690 -0.0049 0.0474 -0.0510 0.0381 0.1431 0.0839 0.0305 0.0339 -0.0384 2020/6/30 0.0506 0.0475 -0.0212 -0.0157 0.0370 0.0217 0.0085 0.0484 0.0591 0.0116 2020/7/31 0.0288 0.0323 -0.0626 0.0342 -0.0380 0.0530 -0.0023 2020/8/31 0.0971 -0.0031 0.0402 0.0462 0.1515 -0.0853 -0.0480 2020/9/30 -0.0242 -0.0658 -0.1074 0.0082 -0.0032 -0.0639 -0.0286 -0.0359 -0.0332 2020/10/30 0.0107 0.0456 -0.0097 0.0096 -0.0348 0.0858 -0.0105 -0.0344 -0.0149 2020/11/30 0.0843 -0.0066 0.2824 0.0289 0.1198 0.0414 0.0766 0.1290 0.0147 2020/12/31 0.0139 0.0221 -0.0069 -0.0469 -0.0218 0.0857 0.0877 -0.0280 -0.0538 2021/1/29 0.0478 0.0202 0.0096 -0.0170 -0.0307 0.0020 -0.0100 0.0448 -0.0009 2021/2/26 -0.0262 -0.0450 0.0250 -0.0282 -0.0184 -0.0802 0.0706 -0.0307 0.0150 -0.0802 2021/3/31 0.0668 0.0274 -0.0022 0.0243 0.0344 -0.0267 0.0587 0.0681 0.0748 0.0179 2021/4/30 -0.0237 -0.0468 -0.0154 0.0344 0.0304 0.0287 0.0347 0.0415 0.0979 -0.0116 2021/5/31 0.0316 0.0237 -0.0112 -0.0910 0.0206 -0.0662 2021/6/30 0.0453 0.0543 0.0415 0.0214 0.0310 0.1236 0.0008 0.0563 0.0345 2021/7/31 -0.0055 0.0150 -0.0241 0.0111 0.0409 -0.0636 0.0706 -0.0148 0.0160 Calculate the optimal portfolio for both investors that consists of all eleven industries. Compare this to the other portfolios in terms of diversification benefits. What do you observe? Contrast the differences in what you observe between the two investors. (15 marks) The spreadsheet Group Report Data.xlsx contains monthly returns on ten Australian industry indices from January 2016 to July 2021. The industry abbreviations are in the table below. Investor utility is represented by: U = E(R) – ½Ao?. There are two investors with diffèrent risk aversion coefficients (A). Angela has a risk aversion coefficient of 5 and Boris has a risk aversion coefficient of 2. Investors are able to short-sell each industry throughout the report. Investors are unable to borrow or lend at the risk-free rate except for part 5 of the report. The expected returns per month to be used throughout the report are in the following table. Industry Consumer Discretionary Consumer Staples Energy Abbreviation COND Expected Return 0.96% CONS 0.83% ENGY 1.09% Health Care HC 0.86% Industrials INDU 0.92% Information Technology IT 1.00% Materials МATL 0.87% 0.90% Telecom TELE Utilities UTIL 0.80% Financials FIN 0.90% Real Estate RE 0.96% Date COND CONS ENGY HC INDU IT MATL TELE UTIL -0.0018 -0.0649 -0.0912 0.0073 0.0123 2016/1/29 -0.0265 -0.0258 -0.0269 -0.0491 0.0070 2016/2/29 -0.0157 -0.0484 0.0028 0.0064 0.0584 -0.0546 0.0912 -0.0547 2016/3/31 0.0513 0.0300 0.0616 0.0035 0.0227 0.0563 0.0605 0.0471 0.0130 0.0747 0.0151 0.0256 2016/4/29 -0.0171 0.0105 0.0334 0.0258 0.1430 0.0046 -0.0032 2016/5/31 0.0564 -0.0089 -0.0161 0.0939 0.0705 -0.0301 0.0496 0.0354 2016/6/30 -0.0018 -0.0402 -0.0081 -0.0248 -0.0099 -0.0760 0.0059 -0.0128 0.0563 2016/7/29 0.0890 0.0855 0.0023 0.0700 0.0717 0.0389 0.0779 0.0423 0.0704 -0.0046 -0.0317 -0.0427 -0.0025 2016/8/31 0.0186 0.0236 0.0458 0.0001 -0.0650 -0.0568 0.0028 -0.0613 0.0009 0.0568 0.0116 2016/9/30 0.0162 -0.0033 0.0146 -0.0395 -0.0324 -0.0303 0.0366 -0.0383 -0.0198 -0.0805 -0.0163 2016/10/31 -0.0411 -0.0659 -0.0433 -0.0033 0.0421 -0.0430 2016/11/30 0.0135 0.0243 0.0056 0.0329 0.0010 0.0225 -0.0041 2016/12/30 0.0173 0.0608 0.0086 0.0403 0.0383 0.0052 0.0868 0.0456 0.0477 -0.0319 2017/1/31 -0.0104 0.0072 -0.0441 -0.0418 -0.0168 0.0108 0.0307 -0.0314 0.0028 0.0151 0.0341 0.0435 2017/2/28 0.0602 -0.0213 0.0390 0.0185 2017/3/31 0.0473 0.0547 0.0433 0.0560 0.0363 0.0022 0.0628 2017/4/28 0.0070 -0.0253 -0.0055 0.0340 0.0409 0.0352 -0.0025 -0.0948 0.0308 0.0152 -0.0684 2017/5/31 -0.0032 -0.0044 -0.0238 0.0469 0.0022 -0.0024 0.0338 0.0100 2017/6/30 0.0087 -0.0243 0.0063 -0.0269 0.0608 -0.0750 -0.0025 0.0188 -0.0166 2017/7/31 -0.0063 0.0097 0.0062 -0.0274 -0.0049 0.0348 -0.0421 -0.0528 0.0518 0.0099 0.0457 -0.0111 2017/8/31 -0.0154 0.0517 0.0025 0.0452 -0.0720 0.0322 2017/9/29 0.0060 -0.0138 0.0444 -0.0446 -0.0006 0.0544 0.0087 -0.0187 0.0112 0.0227 -0.0364 2017/10/31 0.0534 0.0641 0.0548 0.0418 0.0844 0.0235 0.0496 2017/11/30 0.0324 0.0433 0.0296 0.0221 0.0450 0.0201 -0.0158 0.0298 2017/12/29 0.0368 0.0167 0.0021 0.0210 0.0652 -0.0048 -0.0095 0.0294 0.0611 0.0546 -0.0448 -0.0020 -0.0119 2018/1/31 -0.0028 0.0311 -0.0201 0.0249 0.0046 0.0077 -0.0435 2018/2/28 -0.0375 0.0696 -0.0037 0.0166 0.0037 -0.0620 -0.0159 -0.0620 -0.0114 0.0308 0.0124 -0.0424 0.0744 2018/3/30 -0.0226 -0.0135 -0.0249 -0.0332 -0.0219 -0.0075 0.1072 0.0041 0.0295 0.0574 0.0719 0.0545 2018/4/30 0.0276 0.0194 0.0216 0.0527 0.0209 0.0197 0.0165 2018/5/31 0.0000 0.0203 -0.1005 0.0103 0.0591 -0.0143 0.0061 2018/6/29 0.0594 0.0774 0.0250 0.0064 0.0590 -0.0549 0.0759 0.0175 0.0359 2018/7/31 -0.0088 0.0118 0.0223 0.0316 -0.0112 -0.0025 2018/8/31 0.0264 -0.0122 0.1042 0.0326 0.1221 -0.0486 0.1302 2018/9/28 -0.0383 -0.0267 0.0427 -0.0730 -0.0215 -0.0065 0.0406 0.0297 -0.0310 -0.0834 -0.1028 -0.0529 -0.1137 0.0099 2018/10/31 -0.0490 -0.0725 -0.0518 -0.0398 -0.0403 2018/11/30 -0.0453 -0.0292 -0.1068 -0.0397 -0.0060 -0.0475 -0.0412 -0.0176 2018/12/31 -0.0194 0.0120 -0.0220 0.0272 0.0513 -0.0326 -0.0029 0.0338 -0.0408 0.0277 2019/1/31 0.0428 0.0273 0.1146 0.0391 0.0882 0.0697 0.0809 0.0592 0.0644 0.0198 0.0403 0.0669 0.0139 2019/2/28 -0.0139 0.0784 0.0133 0.0748 0.0640 0.0338 2019/3/29 0.0368 -0.0415 0.0131 0.0255 0.0340 0.0551 0.0132 2019/4/30 0.0546 0.0733 0.0155 0.0314 0.0315 0.0735 -0.0205 0.0178 -0.0049 2019/5/31 0.0204 -0.0416 -0.0380 0.0354 0.0025 -0.0312 0.0311 0.0711 -0.0062 -0.0332 -0.0620 -0.0135 0.0574 -0.0424 0.0744 0.0197 2018/3/30 -0.0226 -0.0249 -0.0114 -0.0219 -0.0075 0.0719 0.0194 -0.1005 2018/4/30 0.0295 0.1072 0.0308 0.0276 0.0216 2018/5/31 0.0527 0.0000 0.0041 0.0545 0.0124 0.0203 0.0103 0.0774 0.0118 0.0250 0.0064 0.0165 -0.0025 -0.0486 2018/6/29 0.0209 0.0594 0.0590 -0.0549 0.0591 2018/7/31 2018/8/31 0.0175 -0.0112 0.1221 -0.0088 0.0223 0.0316 0.0759 -0.0143 0.0359 0.0264 -0.0122 0.1042 0.0326 0.1302 0.0061 2018/9/28 -0.0383 -0.0267 0.0427 -0.0730 -0.0215 -0.0065 0.0406 0.0297 -0.0310 2018/10/31 -0.0834 -0.0490 -0.1028 -0.0725 -0.0529 -0.1137 -0.0518 -0.0398 -0.0403 2018/11/30 -0.0453 -0.0292 -0.1068 -0.0397 -0.0060 0.0099 -0.0475 -0.0412 -0.0176 2018/12/31 0.0120 -0.0220 -0.0029 0.0338 0.0644 -0.0194 0.0272 -0.0408 0.0513 -0.0326 0.0277 0.1146 0.0784 2019/1/31 0.0428 0.0273 0.0391 0.0882 0.0697 0.0809 0.0592 2019/2/28 0.0669 -0.0139 0.0133 0.0748 0.0640 0.0338 0.0403 2019/3/29 0.0139 0.0255 0.0340 0.0132 0.0368 0.0733 -0.0415 0.0131 0.0198 0.0551 2019/4/30 0.0546 0.0155 0.0314 0.0315 0.0735 -0.0205 0.0178 -0.0049 2019/5/31 0.0204 -0.0416 0.0292 -0.0380 0.0354 0.0025 -0.0312 0.0711 -0.0062 0.0311 0.0617 0.0442 0.0596 2019/6/28 -0.0151 0.0217 0.0555 0.0105 0.0302 0.0308 0.0204 -0.0460 2019/7/31 0.0475 0.0959 0.0149 0.0335 0.0511 0.0117 0.0185 2019/8/30 0.0064 0.0010 -0.0562 0.0343 -0.0250 0.0067 -0.0734 -0.0224 2019/9/30 0.0333 0.0174 0.0446 -0.0215 -0.0013 0.0011 0.0295 -0.0425 0.0201 2019/10/31 0.0055 -0.0224 0.0031 0.0727 0.0289 -0.0319 -0.0176 -0.0081 0.0123 0.1055 -0.0389 2019/11/29 0.0422 0.0810 0.0729 0.0881 0.0397 0.0444 0.0945 -0.0053 2019/12/31 -0.0221 -0.0775 -0.0138 -0.0266 -0.0305 0.0182 -0.0761 0.0078 2020/1/31 0.0427 0.0781 0.0057 0.1201 0.0186 0.1024 0.0163 0.0872 0.0098 -0.0874 -0.2642 0.1644 -0.0740 -0.0355 0.0259 -0.1742 -0.3764 0.2521 -0.0395 -0.0564 -0.0744 -0.1062 -0.0841 -0.1631 -0.1169 -0.1325 2020/2/28 -0.0396 -0.0674 0.0323 2020/3/31 -0.2301 -0.1758 2020/4/30 0.0487 0.1282 0.2184 0.1437 0.0095 0.0642 -0.0256 2020/5/29 0.0690 -0.0049 0.0474 -0.0510 0.0381 0.1431 0.0839 0.0305 0.0339 -0.0384 2020/6/30 0.0506 0.0475 -0.0212 -0.0157 0.0370 0.0217 0.0085 0.0484 0.0591 0.0116 2020/7/31 0.0288 0.0323 -0.0626 0.0342 -0.0380 0.0530 -0.0023 2020/8/31 0.0971 -0.0031 0.0402 0.0462 0.1515 -0.0853 -0.0480 2020/9/30 -0.0242 -0.0658 -0.1074 0.0082 -0.0032 -0.0639 -0.0286 -0.0359 -0.0332 2020/10/30 0.0107 0.0456 -0.0097 0.0096 -0.0348 0.0858 -0.0105 -0.0344 -0.0149 2020/11/30 0.0843 -0.0066 0.2824 0.0289 0.1198 0.0414 0.0766 0.1290 0.0147 2020/12/31 0.0139 0.0221 -0.0069 -0.0469 -0.0218 0.0857 0.0877 -0.0280 -0.0538 2021/1/29 0.0478 0.0202 0.0096 -0.0170 -0.0307 0.0020 -0.0100 0.0448 -0.0009 2021/2/26 -0.0262 -0.0450 0.0250 -0.0282 -0.0184 -0.0802 0.0706 -0.0307 0.0150 -0.0802 2021/3/31 0.0668 0.0274 -0.0022 0.0243 0.0344 -0.0267 0.0587 0.0681 0.0748 0.0179 2021/4/30 -0.0237 -0.0468 -0.0154 0.0344 0.0304 0.0287 0.0347 0.0415 0.0979 -0.0116 2021/5/31 0.0316 0.0237 -0.0112 -0.0910 0.0206 -0.0662 2021/6/30 0.0453 0.0543 0.0415 0.0214 0.0310 0.1236 0.0008 0.0563 0.0345 2021/7/31 -0.0055 0.0150 -0.0241 0.0111 0.0409 -0.0636 0.0706 -0.0148 0.0160 Calculate the optimal portfolio for both investors that consists of all eleven industries. Compare this to the other portfolios in terms of diversification benefits. What do you observe? Contrast the differences in what you observe between the two investors. (15 marks)
Expert Answer:
Answer rating: 100% (QA)
Answer i Industries with the highest utility will have a better return risk tradeoff ii Based on this reason we can select the highest utility industr... View the full answer

Related Book For 

Data Analysis and Decision Making
ISBN: 978-0538476126
4th edition
Authors: Christian Albright, Wayne Winston, Christopher Zappe
Posted Date:
Students also viewed these finance questions
-
A bank can borrow or lend at LIBOR. The two-month LIBOR rate is 0.28% per annum with continuous compounding. Assuming that interest rates cannot be negative, what is the arbitrage opportunity if the...
-
A bank can borrow or lend at LIBOR. Suppose that the six-month rate is 5% and the nine-month rate is 6%. The rate that can be locked in for the period between six months and nine months using an FRA...
-
The file S02_41.xlsx contains monthly returns on Barnes and Noble stock for several years. As the formulas in the file indicate, each return is the percentage change in the adjusted closing price...
-
Bloomberg Intelligence listed 50 companies to watch in 2018 (www .bloomberg.com/features/companies-to-watch-2018). Twelve of the companies are listed here with their total assets and 12-month sales....
-
A1 Vineyard Fruit Company sells premium-quality oranges and other citrus fruits by mail order. Protecting the fruit during shipping is important so the company has designed and produces shipping...
-
Describe the psychological, physical, behavioral, and organizational consequences of stress.?
-
Krupp Refrigeration, Inc., is trying to reduce inventory and wants you to install a kanban system for compressors on one of its assembly lines. Determine the size of the kanban and the number of...
-
Chicagos Hard Rock Hotel distributes a mean of 1,000 bath towels per day to guests at t he pool and in their rooms. This demand is normally distributed with a standard deviation of 100 towels per...
-
The following operating and cost data occurred during October: October 1, Inventory: 30,000 units Direct materials .......$60,000 Direct labor .......... 7,500 Overhead 15,000 October 31, Inventory:...
-
You are a young CPA just starting your own practice in Hollywood, California, after five years experience with a Big 4 firm. You have several connections in the entertainment industry and hope to...
-
Can you elaborate on the role of photosynthetic electron carriers, such as plastoquinone, plastocyanin, and ferredoxin, in shuttling electrons between photosystems and driving ATP synthesis and NADPH...
-
White et al. (2009) propose a social network as a one-stop shop solution for global information dissemination and communication during all stages of an emergency. How feasible is this? What...
-
Information systems are crucial management tools during crisis, but for small or medium-size organizations they can be costly. What factors should an organization consider in justifying the cost of a...
-
Discuss how reliability models are used to provide information to support decisions regarding systems availability.
-
Discuss how improper maintenance policies lead to business continuity problems.
-
Explore the uses of regression analysis as a tool for risk and business continuity management.
-
Assume an organization encourages casual dress and has a long tradition of having "beer Fridays," where they provide snacks to allow teams to get together in a casual environment. What concept does...
-
Complete the following acid-base reactions: (a) HCCH + NaH
-
The file S02_21.xlsx contains monthly interest rates on 30-year fixed-rate mortgages in the United States from 1977 to 2009. The file also contains rates on15-year fixed-rate mortgages from late 1991...
-
The file S03_65.xlsx lists a lot of data for each NBA team for the seasons 20042005 to 20082009. The variables are divided into groups: (1) Overall success, (2) Offensive, and (3) Defensive. The...
-
The CEO of a medical supply company is committed to expanding the proportion of highly qualified women in the organizations staff of salespersons. He claims that the proportion of women in similar...
-
Fill in the Blank. In a random process, the outcome of an experiment will be a function of some _________ such as time.
-
What is the covariance between two random variables \(X\) and \(Y\) ?
-
The joint density function of two random variables \(X\) and \(Y\) is given by \[p_{X, Y}(x, y)= \begin{cases}\frac{x y}{9}, & 0 \leq x \leq 2,0 \leq y \leq 3 \\ 0, & \text { elsewhere }\end{cases}\]...

Study smarter with the SolutionInn App