

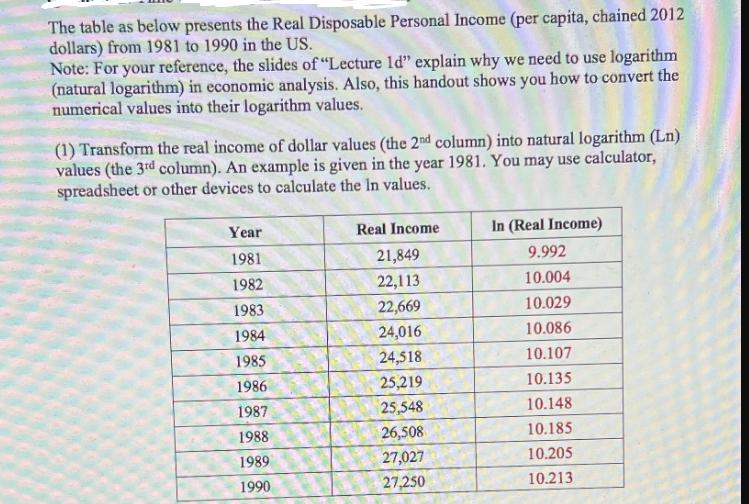
The table as below presents the Real Disposable Personal Income (per capita, chained 2012 dollars) from...
Fantastic news! We've Found the answer you've been seeking!
Question:

Expert Answer:

Related Book For 
Forecasting for Economics and Business
ISBN: 978-0131474932
1st edition
Authors: Gloria Gonzalez Rivera
Posted Date:
