

Question: Use the graph of the normal distribution to determine the mean and standard deviation. (Hint: The distance between dotted lines in the figure represents 1
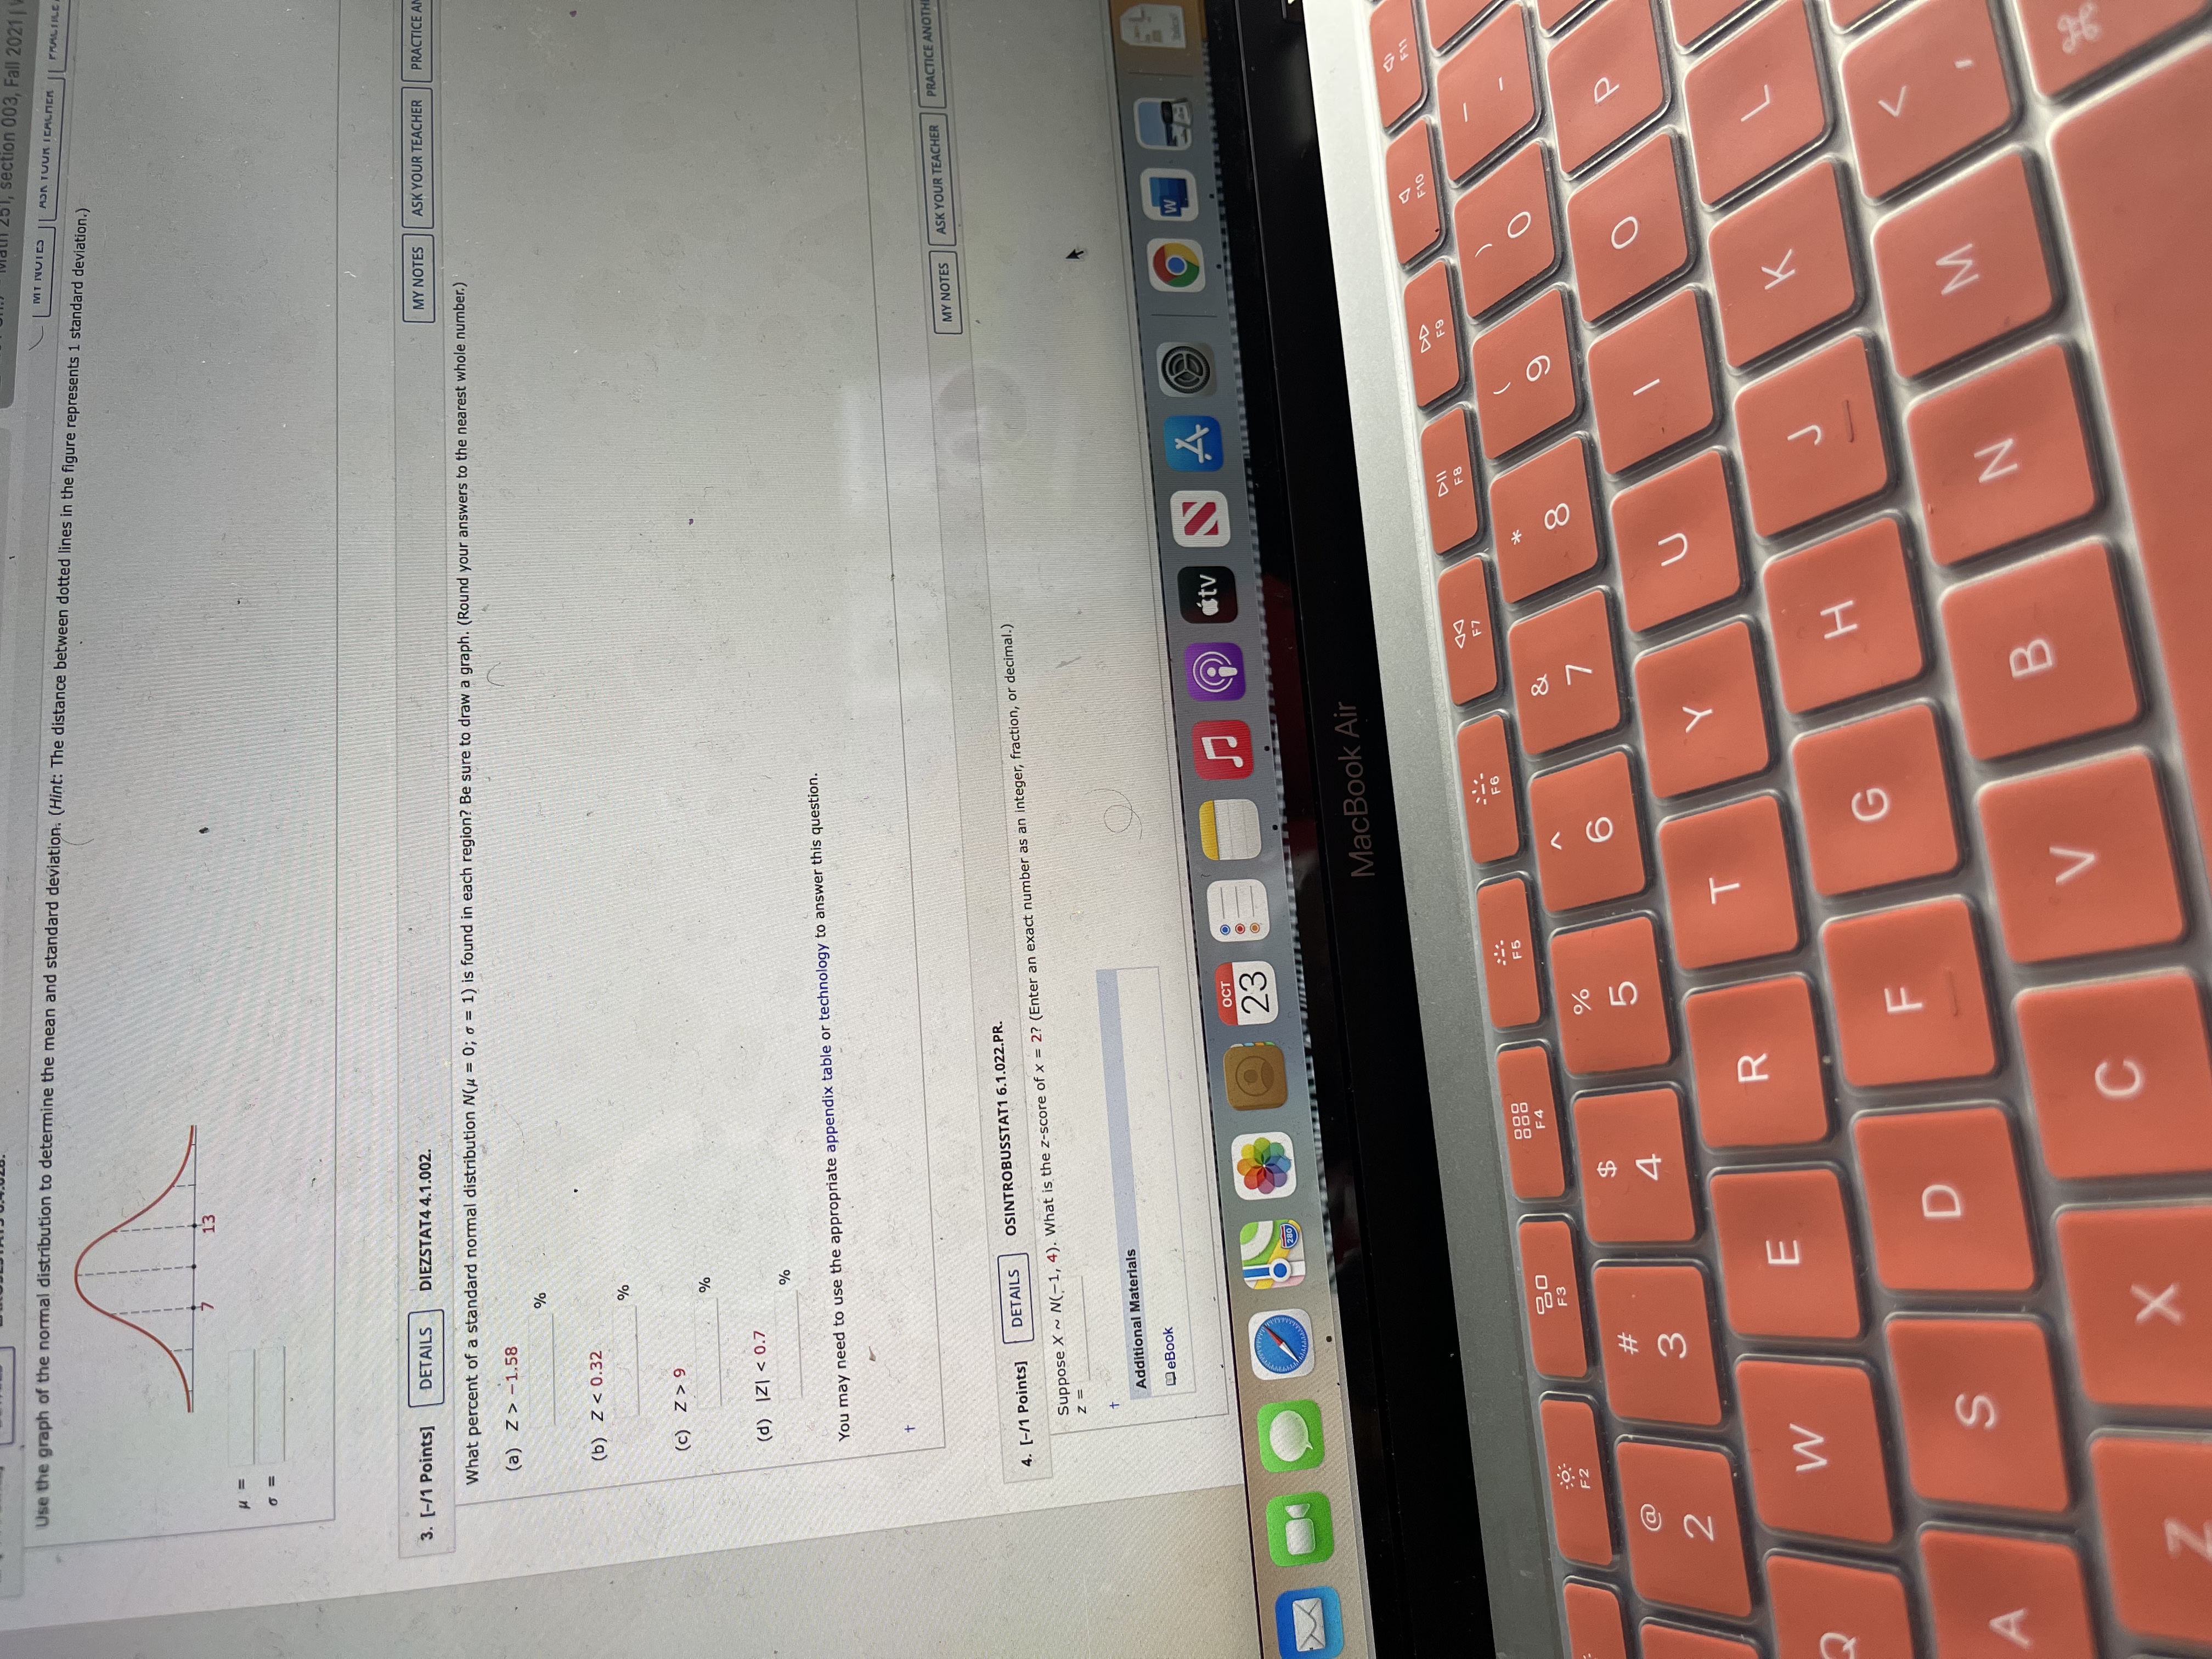
Use the graph of the normal distribution to determine the mean and standard deviation. (Hint: The distance between dotted lines in the figure represents 1 standard deviation.) ion 003, Fall 2021 MT NUIES MON TOUR ICALMER | PRACTICE 13 3. [-/1 Points] DETAILS DIEZSTAT4 4.1.002. (a) Z> -1.58 What percent of a standard normal distribution N(# = 0; o = 1) is found in each region? Be sure to draw a graph. (Round your answers to the nearest whole number.) MY NOTES ASK YOUR TEACHER PRACTICE A (b) Z
Step by Step Solution
There are 3 Steps involved in it
1 Expert Approved Answer
Step: 1 Unlock

Question Has Been Solved by an Expert!
Get step-by-step solutions from verified subject matter experts
Step: 2 Unlock
Step: 3 Unlock