

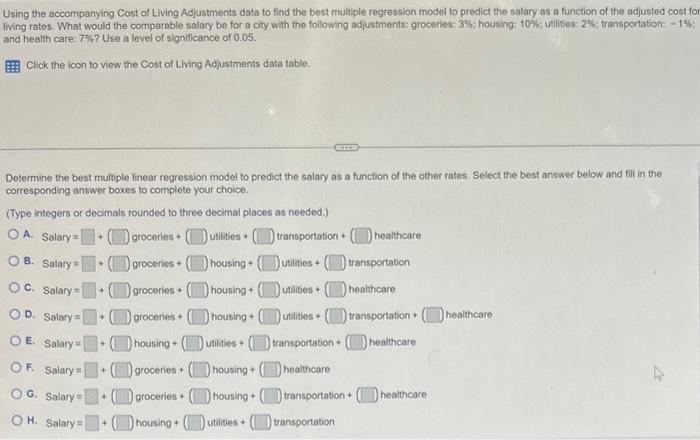
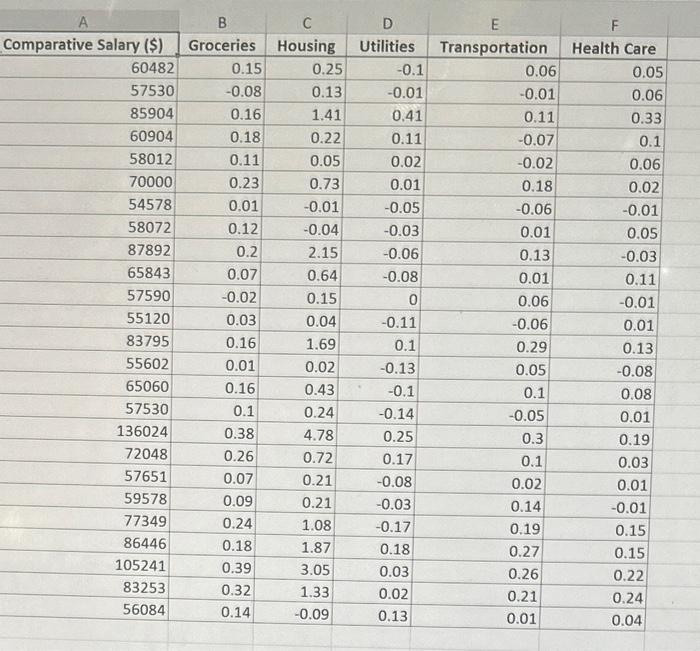
Using the accompanying Cost of Living Adjustments data to find the best multiple regression model to...
Fantastic news! We've Found the answer you've been seeking!
Question:
Expert Answer:
To determine the best multiple linear regression model to predict the salary as a function of the ad... View the full answer

Related Book For 
Posted Date:
