

The following Stem and Leaf Plot represents the distribution of weights of a group of people. 1.
Fantastic news! We've Found the answer you've been seeking!
Question:
The following Stem and Leaf Plot represents the distribution of weights of a group of people.
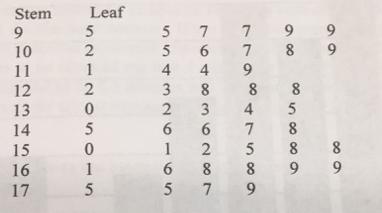
1. What is the weight of the lightest person?
2. How many people weigh in the range from 122 to 128?
3. What is the weight of the heaviest person in the range 161 to 169?
Expert Answer:

Related Book For 
Posted Date:
