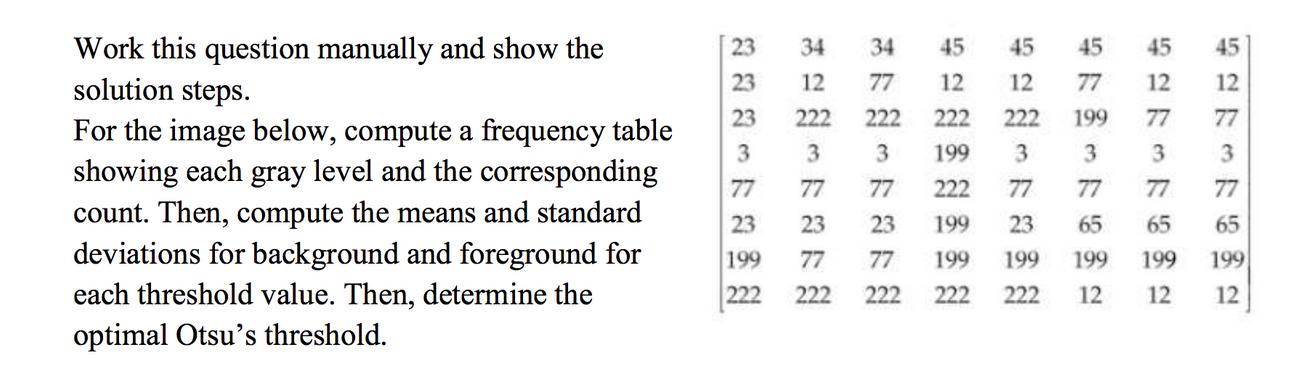
Work this question manually and show the solution steps. For the image below, compute a frequency...
Fantastic news! We've Found the answer you've been seeking!
Question:
Transcribed Image Text:
Work this question manually and show the solution steps. For the image below, compute a frequency table showing each gray level and the corresponding count. Then, compute the means and standard deviations for background and foreground for each threshold value. Then, determine the optimal Otsu's threshold. 34 12 77 222 3 2222222 23 23 199 199 222 222 77 34 45 45 45 45 45 12 12 77 12 12 222 222 222 3 199 3 77 77 222 77 77 77 77 23 65 65 65 77 199 199 199 199 199 222 222 2 222 12 12 12 THREE THREE 199 77 77 22 3 Work this question manually and show the solution steps. For the image below, compute a frequency table showing each gray level and the corresponding count. Then, compute the means and standard deviations for background and foreground for each threshold value. Then, determine the optimal Otsu's threshold. 34 12 77 222 3 2222222 23 23 199 199 222 222 77 34 45 45 45 45 45 12 12 77 12 12 222 222 222 3 199 3 77 77 222 77 77 77 77 23 65 65 65 77 199 199 199 199 199 222 222 2 222 12 12 12 THREE THREE 199 77 77 22 3
Expert Answer:
Posted Date:
Students also viewed these programming questions
-
A researcher wanted to find out if there was difference between older movie goers and younger movie goers with respect to their estimates of a successful actors income. The researcher first...
-
Managing Scope Changes Case Study Scope changes on a project can occur regardless of how well the project is planned or executed. Scope changes can be the result of something that was omitted during...
-
Simplify each expression. Assume that all variables represent nonzero real numbers. 52
-
How does herding lead to price fluctuations?
-
Give a curved-arrow mechanism for the electrophilic aromatic substitution reaction shown in Eq. 23.52.
-
The following table shows data from a dehumidification process using aqueous solution of lithium chloride ( \(\mathrm{LiCl}\) ) in a packed tower. The desiccant leaving the dehumidifier is passed...
-
Deitz Inc. has three divisions which are operated as profit centers. Actual operating data for the divisions listed alphabetically are as follows. Instructions (a) Compute the missing amounts. Show...
-
ToyJoy! estimates that customers will be granted 2,600 in refunds of this year's sales next year and the merchandise expected to be returned will have a cost $2,000. How would I journalize the...
-
Calculate the historical volatility of the NASDAQ index over the last year by computing the standard deviation of historical returns and multiplying by sqrt(252). (The number of trading days in a...
-
Case Title: Harvard Case Study: Codecademy Monetizing a Movement What are the main reasons behind Codecademy's rapid growth? What kind of monetization model should the company introduce in the future?
-
The beginning of the wheel of retailing (when low-price institutions first appear) corresponds to which retail life-cycle stage?
-
How international company will do market entry strategy into Norway market.
-
A paperless, computer-to-computer relationship between retailers and their vendors is ________.
-
Based on the pathos strategies the author uses, provide a critical evaluation as to whether or not the author is successful in being emotionally persuasive. Why Twitter Wants You To Hate (Coren, 2017)
-
Discuss the Issues in Contemporary Society
-
Use nodal analysis to determine voltages v1, v2, and v3 in the circuit Fig. 3.76. Figure 3.76 4 S 3i, 2 A 4A
-
When we are given the value of the _____________________ variable, we can use the least-squares regression line to predict the value of the ______________________ variable. In Exercises 57, fill in...
-
The least-squares regression line predicts the result of changing the value of the explanatory variable. In Exercises 812, determine whether the statement is true or false. If the statement is false,...
-
For each of the following plots, interpret the y-intercept of the least-squares regression line if possible. If not possible, explain why not. a. The least-squares regression line is = 1.98 +...
Study smarter with the SolutionInn App