

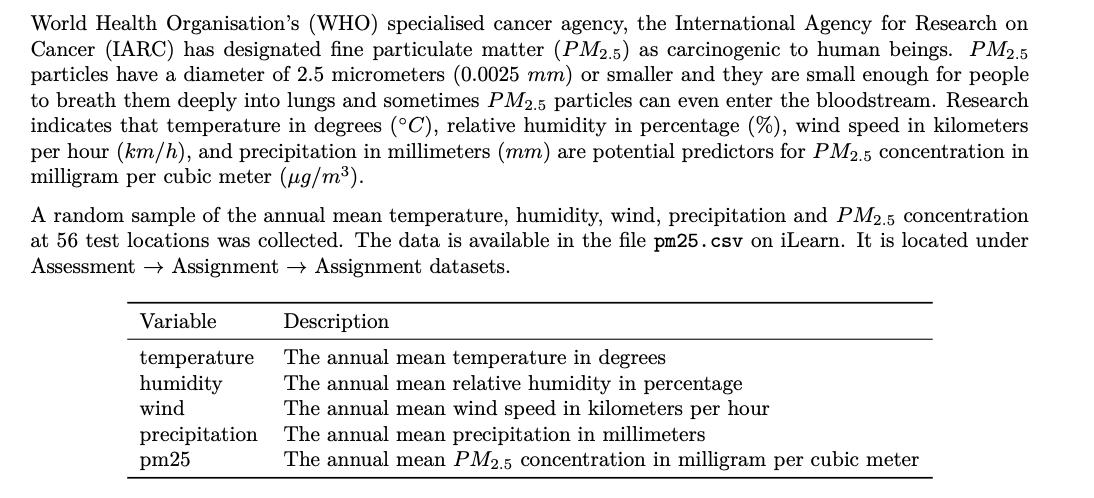
World Health Organisation's (WHO) specialised cancer agency, the International Agency for Research on Cancer (IARC) has...
Fantastic news! We've Found the answer you've been seeking!
Question:
![a. [7 marks] Produce a plot and a correlation matrix of the data. Comment on possible relationships between](https://dsd5zvtm8ll6.cloudfront.net/questions/2024/01/65b0d4b332222_1706087592878.jpg)
![g. [3 marks] Comment on the R and adjusted R2 in the full and final model you chose in part f. In particular](https://dsd5zvtm8ll6.cloudfront.net/questions/2024/01/65b0d4be525cf_1706087614033.jpg)
Expert Answer:
a 7 marks Produce a plot and a correlation matrix of the data Comment on possible relationships between the response and predictors and relationships between the predictors themselves Here is the plot ... View the full answer

Related Book For 
Business And Professional Ethics
ISBN: 9780357441886
9th Edition
Authors: Leonard J Brooks, Paul Dunn
Posted Date:
