

Your friend concerns about her baby's weight whether it is too big at his age. Kevin,...
Fantastic news! We've Found the answer you've been seeking!
Question:

Transcribed Image Text:
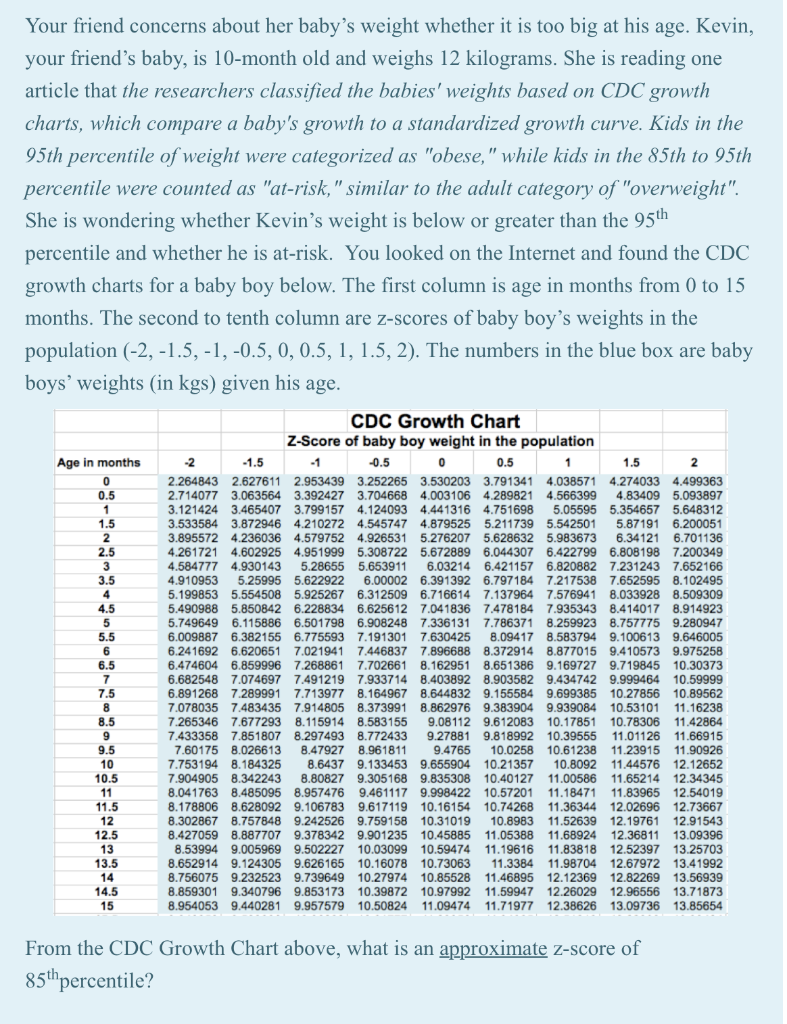
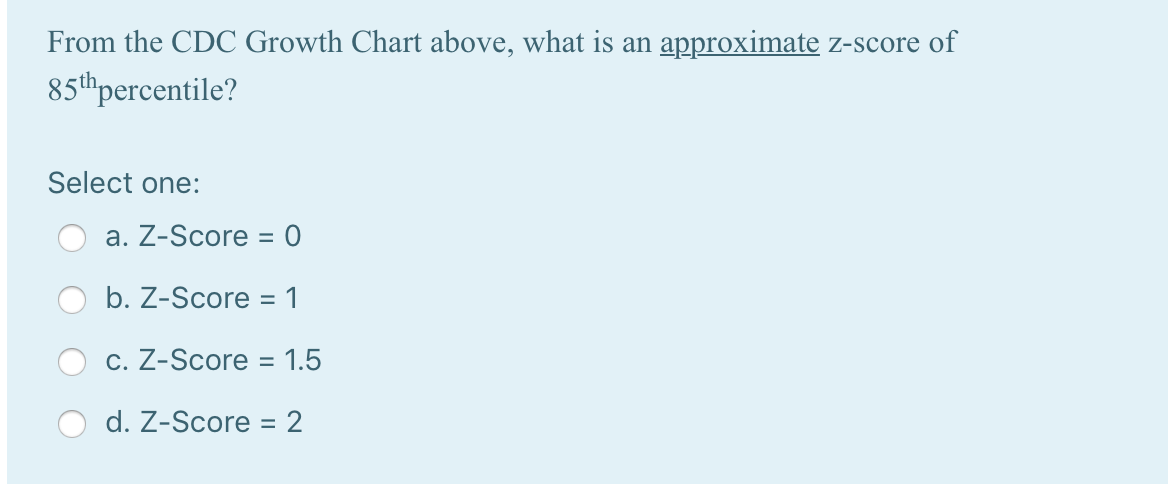
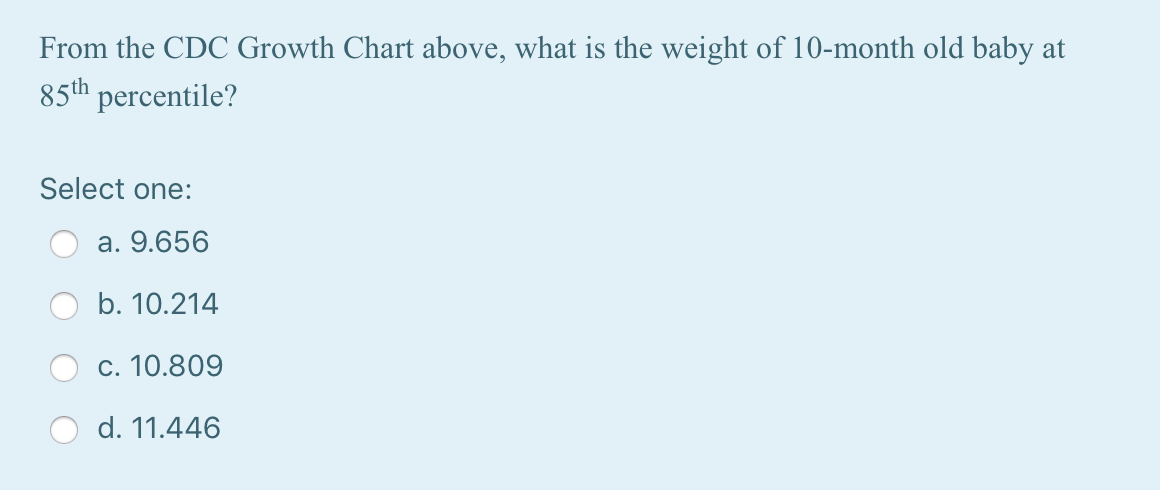
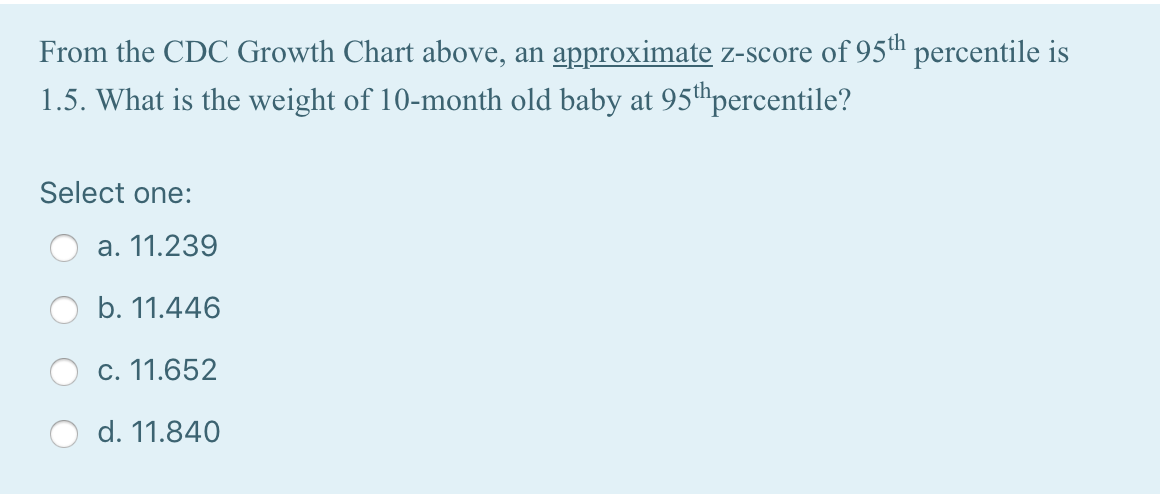
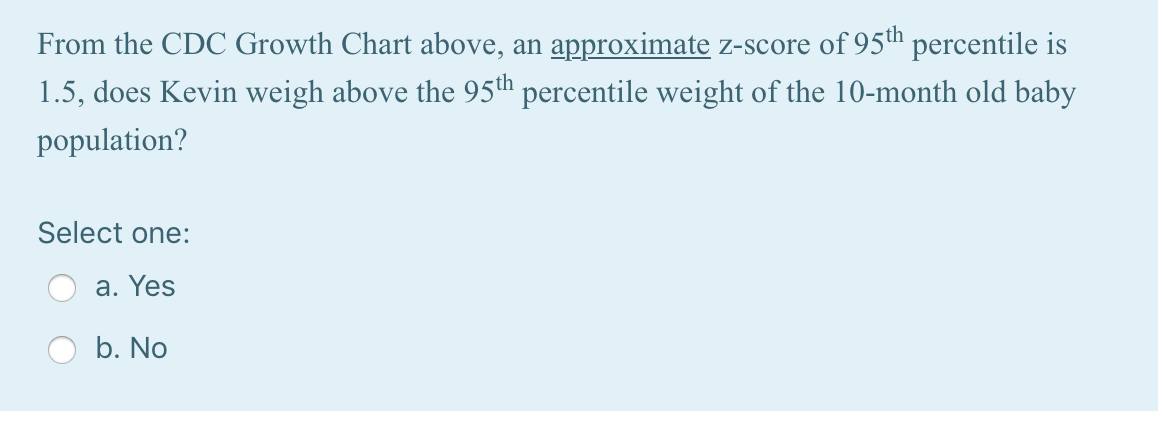
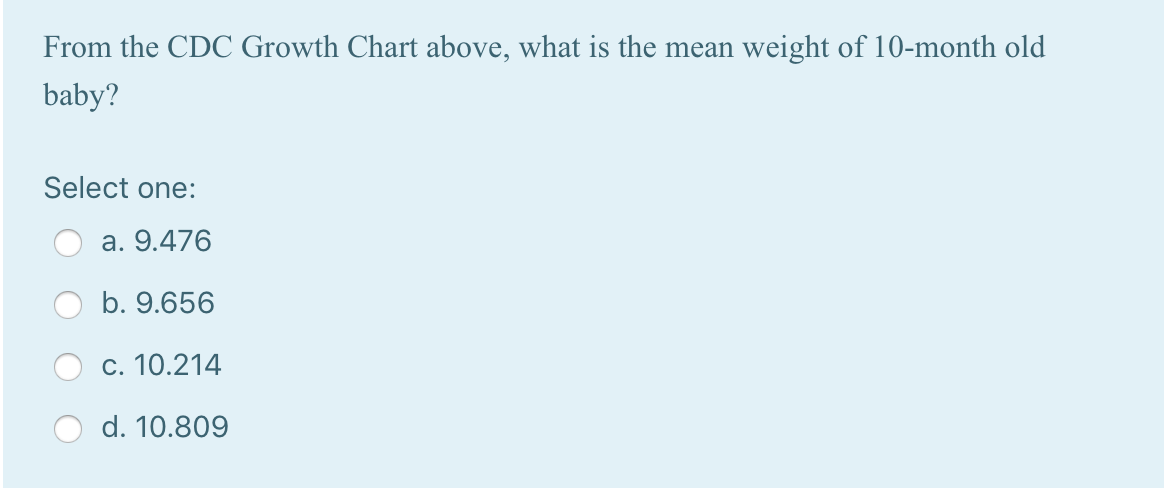
Your friend concerns about her baby's weight whether it is too big at his age. Kevin, your friend's baby, is 10-month old and weighs 12 kilograms. She is reading one article that the researchers classified the babies' weights based on CDC growth charts, which compare a baby's growth to a standardized growth curve. Kids in the 95th percentile of weight were categorized as "obese," while kids in the 85th to 95th percentile were counted as "at-risk," similar to the adult category of "overweight". She is wondering whether Kevin's weight is below or greater than the 95th percentile and whether he is at-risk. You looked on the Internet and found the CDC growth charts for a baby boy below. The first column is age in months from 0 to 15 months. The second to tenth column are z-scores of baby boy's weights in the population (-2,-1.5, -1, -0.5, 0, 0.5, 1, 1.5, 2). The numbers in the blue box are baby boys' weights (in kgs) given his age. Age in months 0 0.5 1 1.5 2 2.5 3 3.5 4 4.5 5 5.5 6 6.5 7 7.5 8 8.5 9 9.5 10 10.5 11 11.5 12 12.5 13 13.5 14 14.5 15 CDC Growth Chart Z-Score of baby boy weight in the population -2 -1.5 0 0.5 1 2 -1 -0.5 1.5 2.264843 2.627611 2.953439 3.252265 3.530203 3.791341 4.038571 4.274033 4.499363 2.714077 3.063564 3.392427 3.704668 4.003106 4.289821 4.566399 4.83409 5.093897 3.121424 3.465407 3.799157 4.124093 4.441316 4.751698 5.05595 5.354657 5.648312 3.533584 3.872946 4.210272 4.545747 4.879525 5.211739 5.542501 5.87191 6.200051 3.895572 4.236036 4.579752 4.926531 5.276207 5.628632 5.983673 6.34121 6.701136 4.261721 4.602925 4.951999 5.308722 5.672889 6.044307 6.422799 6.808198 7.200349 4.584777 4.930143 5.28655 5.653911 6.03214 6.421157 6.820882 7.231243 7.652166 4.910953 5.25995 5.622922 6.00002 6.391392 6.797184 7.217538 7.652595 8.102495 5.199853 5.554508 5.925267 6.312509 6.716614 7.137964 7.576941 8.033928 8.509309 5.490988 5.850842 6.228834 6.625612 7.041836 7.478184 7.935343 8.414017 8.914923 5.749649 6.115886 6.501798 6.908248 7.336131 7.786371 8.259923 8.757775 9.280947 6.009887 6.382155 6.775593 7.191301 7.630425 8.09417 8.583794 9.100613 9.646005 6.241692 6.620651 7.021941 7.446837 7.896688 8.372914 8.877015 9.410573 9.975258 6.474604 6.859996 7.268861 7.702661 8.162951 8.651386 9.169727 9.719845 10.30373 6.682548 7.074697 7.491219 7.933714 8.403892 8.903582 9.434742 9.999464 10.59999 6.891268 7.289991 7.713977 8.164967 8.644832 9.155584 9.699385 10.27856 10.89562 7.078035 7.483435 7.914805 8.373991 8.862976 9.383904 9.939084 10.53101 11.16238 7.265346 7.677293 8.115914 8.583155 9.08112 9.612083 10.17851 10.78306 11.42864 7.433358 7.851807 8.297493 8.772433 9.27881 9.818992 10.39555 11.01126 11.01126 11.66915 7.60175 8.026613 8.47927 8.961811 9.4765 10.0258 10.61238 11.23915 11.90926 7.753194 8.184325 8.6437 9.133453 9.655904 10.21357 10.8092 11.44576 12.12652 7.904905 8.342243 8.80827 9.305168 9.835308 10.40127 11.00586 11.65214 12.34345 8.041763 8.485095 8.957476 9.461117 9.998422 10.57201 11.18471 11.83965 12.54019 8.178806 8.628092 9.106783 9.617119 10.16154 10.74268 11.36344 12.02696 12.73667 8.302867 8.757848 9.242526 9.759158 10.31019 10.8983 11.52639 12.19761 12.91543 8.427059 8.887707 9.378342 9.901235 10.45885 11.05388 11.68924 12.36811 13.09396 8.53994 9.005969 9.502227 10.03099 1.03099 10.59474 10.59474 11.19616 11.83818 2.52397 13.25703 8.652914 9.124305 9.626165 10.16078 10.73063 11.3384 11.98704 12.67972 13.41992 8.756075 9.232523 9.739649 10.27974 10.85528 11.46895 12.12369 12.82269 13.56939 8.859301 9.340796 9.853173 10.39872 10.97992 11.59947 12.26029 12.96556 13.71873 8.954053 9.440281 9.957579 10.50824 11.09474 11.71977 12.38626 13.09736 13.85654 From the CDC Growth Chart above, what is an approximate z-score of 85th percentile? From the CDC Growth Chart above, what is an approximate z-score of 85th percentile? Select one: a. Z-Score = 0 b. Z-Score = 1 c. Z-Score = 1.5 d. Z-Score = 2 From the CDC Growth Chart above, what is the weight of 10-month old baby at 85th percentile? Select one: a. 9.656 b. 10.214 c. 10.809 d. 11.446 From the CDC Growth Chart above, does Kevin weigh above the 85th percentile weight of the 10-month old baby population? Select one: a. Yes b. No From the CDC Growth Chart above, an approximate z-score of 95th percentile is 1.5. What is the weight of 10-month old baby at 95th percentile? Select one: a. 11.239 b. 11.446 c. 11.652 d. 11.840 From the CDC Growth Chart above, an approximate z-score of 95th percentile is 1.5. What is the weight of 10-month old baby at 95th percentile? Select one: a. 11.239 b. 11.446 c. 11.652 d. 11.840 From the CDC Growth Chart above, an approximate z-score of 95th percentile is 1.5, does Kevin weigh above the 95th percentile weight of the 10-month old baby population? Select one: a. Yes b. No From the CDC Growth Chart above, what is the mean weight of 10-month old baby? Select one: a. 9.476 b. 9.656 c. 10.214 d. 10.809 Your friend concerns about her baby's weight whether it is too big at his age. Kevin, your friend's baby, is 10-month old and weighs 12 kilograms. She is reading one article that the researchers classified the babies' weights based on CDC growth charts, which compare a baby's growth to a standardized growth curve. Kids in the 95th percentile of weight were categorized as "obese," while kids in the 85th to 95th percentile were counted as "at-risk," similar to the adult category of "overweight". She is wondering whether Kevin's weight is below or greater than the 95th percentile and whether he is at-risk. You looked on the Internet and found the CDC growth charts for a baby boy below. The first column is age in months from 0 to 15 months. The second to tenth column are z-scores of baby boy's weights in the population (-2,-1.5, -1, -0.5, 0, 0.5, 1, 1.5, 2). The numbers in the blue box are baby boys' weights (in kgs) given his age. Age in months 0 0.5 1 1.5 2 2.5 3 3.5 4 4.5 5 5.5 6 6.5 7 7.5 8 8.5 9 9.5 10 10.5 11 11.5 12 12.5 13 13.5 14 14.5 15 CDC Growth Chart Z-Score of baby boy weight in the population -2 -1.5 0 0.5 1 2 -1 -0.5 1.5 2.264843 2.627611 2.953439 3.252265 3.530203 3.791341 4.038571 4.274033 4.499363 2.714077 3.063564 3.392427 3.704668 4.003106 4.289821 4.566399 4.83409 5.093897 3.121424 3.465407 3.799157 4.124093 4.441316 4.751698 5.05595 5.354657 5.648312 3.533584 3.872946 4.210272 4.545747 4.879525 5.211739 5.542501 5.87191 6.200051 3.895572 4.236036 4.579752 4.926531 5.276207 5.628632 5.983673 6.34121 6.701136 4.261721 4.602925 4.951999 5.308722 5.672889 6.044307 6.422799 6.808198 7.200349 4.584777 4.930143 5.28655 5.653911 6.03214 6.421157 6.820882 7.231243 7.652166 4.910953 5.25995 5.622922 6.00002 6.391392 6.797184 7.217538 7.652595 8.102495 5.199853 5.554508 5.925267 6.312509 6.716614 7.137964 7.576941 8.033928 8.509309 5.490988 5.850842 6.228834 6.625612 7.041836 7.478184 7.935343 8.414017 8.914923 5.749649 6.115886 6.501798 6.908248 7.336131 7.786371 8.259923 8.757775 9.280947 6.009887 6.382155 6.775593 7.191301 7.630425 8.09417 8.583794 9.100613 9.646005 6.241692 6.620651 7.021941 7.446837 7.896688 8.372914 8.877015 9.410573 9.975258 6.474604 6.859996 7.268861 7.702661 8.162951 8.651386 9.169727 9.719845 10.30373 6.682548 7.074697 7.491219 7.933714 8.403892 8.903582 9.434742 9.999464 10.59999 6.891268 7.289991 7.713977 8.164967 8.644832 9.155584 9.699385 10.27856 10.89562 7.078035 7.483435 7.914805 8.373991 8.862976 9.383904 9.939084 10.53101 11.16238 7.265346 7.677293 8.115914 8.583155 9.08112 9.612083 10.17851 10.78306 11.42864 7.433358 7.851807 8.297493 8.772433 9.27881 9.818992 10.39555 11.01126 11.01126 11.66915 7.60175 8.026613 8.47927 8.961811 9.4765 10.0258 10.61238 11.23915 11.90926 7.753194 8.184325 8.6437 9.133453 9.655904 10.21357 10.8092 11.44576 12.12652 7.904905 8.342243 8.80827 9.305168 9.835308 10.40127 11.00586 11.65214 12.34345 8.041763 8.485095 8.957476 9.461117 9.998422 10.57201 11.18471 11.83965 12.54019 8.178806 8.628092 9.106783 9.617119 10.16154 10.74268 11.36344 12.02696 12.73667 8.302867 8.757848 9.242526 9.759158 10.31019 10.8983 11.52639 12.19761 12.91543 8.427059 8.887707 9.378342 9.901235 10.45885 11.05388 11.68924 12.36811 13.09396 8.53994 9.005969 9.502227 10.03099 1.03099 10.59474 10.59474 11.19616 11.83818 2.52397 13.25703 8.652914 9.124305 9.626165 10.16078 10.73063 11.3384 11.98704 12.67972 13.41992 8.756075 9.232523 9.739649 10.27974 10.85528 11.46895 12.12369 12.82269 13.56939 8.859301 9.340796 9.853173 10.39872 10.97992 11.59947 12.26029 12.96556 13.71873 8.954053 9.440281 9.957579 10.50824 11.09474 11.71977 12.38626 13.09736 13.85654 From the CDC Growth Chart above, what is an approximate z-score of 85th percentile? From the CDC Growth Chart above, what is an approximate z-score of 85th percentile? Select one: a. Z-Score = 0 b. Z-Score = 1 c. Z-Score = 1.5 d. Z-Score = 2 From the CDC Growth Chart above, what is the weight of 10-month old baby at 85th percentile? Select one: a. 9.656 b. 10.214 c. 10.809 d. 11.446 From the CDC Growth Chart above, does Kevin weigh above the 85th percentile weight of the 10-month old baby population? Select one: a. Yes b. No From the CDC Growth Chart above, an approximate z-score of 95th percentile is 1.5. What is the weight of 10-month old baby at 95th percentile? Select one: a. 11.239 b. 11.446 c. 11.652 d. 11.840 From the CDC Growth Chart above, an approximate z-score of 95th percentile is 1.5. What is the weight of 10-month old baby at 95th percentile? Select one: a. 11.239 b. 11.446 c. 11.652 d. 11.840 From the CDC Growth Chart above, an approximate z-score of 95th percentile is 1.5, does Kevin weigh above the 95th percentile weight of the 10-month old baby population? Select one: a. Yes b. No From the CDC Growth Chart above, what is the mean weight of 10-month old baby? Select one: a. 9.476 b. 9.656 c. 10.214 d. 10.809
Expert Answer:
Answer rating: 100% (QA)
a We know PZ 1036433 085 Using Rcode qnorm 085 Hence b ZScore 1 approximated for 85th percentile b ... View the full answer

Related Book For 

Posted Date:
Students also viewed these mathematics questions
-
Lamonte Company reports the following budgeted December 31 adjusted trial balance. Cash Accounts receivable Merchandise inventory Equipment Accumulated depreciation-Equipment Accounts payable Loan...
-
The Crazy Eddie fraud may appear smaller and gentler than the massive billion-dollar frauds exposed in recent times, such as Bernie Madoffs Ponzi scheme, frauds in the subprime mortgage market, the...
-
Write a literature review for your study. See below for an example of a literature review. Your literature review should provide both analysis and synthesis of previous studies as related to the...
-
We plan to remove about 90% of the A present in a gas stream by absorption in water which contains reactant B. Chemicals A and B react in the liquid as follows: B has a negligible vapor pressure,...
-
The drawing shows a uniform electric field that points in the negative y direction; the magnitude of the field is 3600 N/C. Determine the electric potential difference (a) VB - VA between points A...
-
In Chapter 8 (Task 9) we looked at data based on findings that the number of cups of tea drunk was related to cognitive functioning (Feng et al., 2010). Using a linear model that predicts cognitive...
-
Dixens Ltd, a wholesaler of electrical equipment, starts business on 1 January with 100,000 in cash. Required 1 Record all transactions in T-accounts. 2 Prepare a profit and loss statement for the...
-
The partially completed inventory record for the record subassembly in Figure shows gross requirements, scheduled receipts, lead time, and current on-hand inventory. a. Complete the last three rows...
-
3.6 cm 2.4 cm The actual length (L) of a rectangle is 30 centimeters. Use the scale drawing of the rectangle to find the actual width (W). (A) 12.5 B) 45.0 20.0 D 10
-
Derive Laplace transforms of the input signals shown in Figs. E3.2 and E3.3 by summing component functions found in Table 3.1. 10 f(t) 3 t (min) Figure E3.2 Slope = -a u(t) tw Figure E3.3 Triangular...
-
Today I am presented with a 11-year-old girl who comes from a divorced family. Concern has been expressed due to the child's change in mood and weight loss. The child is usually happy and a stellar...
-
How might the need for a new system be recognized? Give two concerns that auditors should have about the ways information systems projects are initiated.
-
When would you use a motion to strike?
-
Why might different normative models of the systems development process be appropriate for auditors to use at different times? Give an example to help your explanation.
-
Identify the grounds for a demurrer.
-
When consolidation and separation of trials may occur?
-
Self Learning Switches (c). Consider the network below with sixnodes, star-connected into an Ethernet switch. Suppose that A sendsa frame to A, A?? replies to A, then B sends a message to B?? and...
-
You deposit $10,000 in a savings account that earns 7.5% simple interest per year. What is the minimum number of years you must wait to double your balance? Suppose instead that you deposit the...
-
Describe the steps you will take to help ensure that the team has a good balance between conformity and deviance and a moderate level of cohesiveness.
-
Try to remember how you reached the decision. Did you sit down and consciously think through the implications of each alternative, or did you make a decision on the basis of intuition? Did you use...
-
1. Either by yourself or in a group, decide if this business practice of paying bribes is ethical or unethical. 2. Should IBM allow its foreign divisions to pay bribes if all other companies are...
-
Assume that Mexico has a 1-year interest rate that is higher than the U.S. 1-year interest rate. Assume that you believe in the international Fisher effect (IFE) and interest rate parity. Assume zero...
-
Assume that locational arbitrage ensures that spot exchange rates are properly aligned. Also assume that you believe in purchasing power parity. The spot rate of the British pound is $1.80. The spot...
-
The U.S. 3-month interest rate (unannualized) is 1 percent. The Canadian 3-month interest rate (unannualized) is 4 percent. Interest rate parity exists. The expected inflation over this period is 5...

Study smarter with the SolutionInn App