Question:
Consider the 2016 major league baseball data in Table B.22. While team ERA was useful in predicting the number of games that a team wins, there are some other measures of team performance, including the number of strikeouts, the number of errors committed, and the number of runs allowed per game. Fita multiple linear regression model to wins using team ERA, errors, strikeouts, and runs allowed per game as the regressor variables.
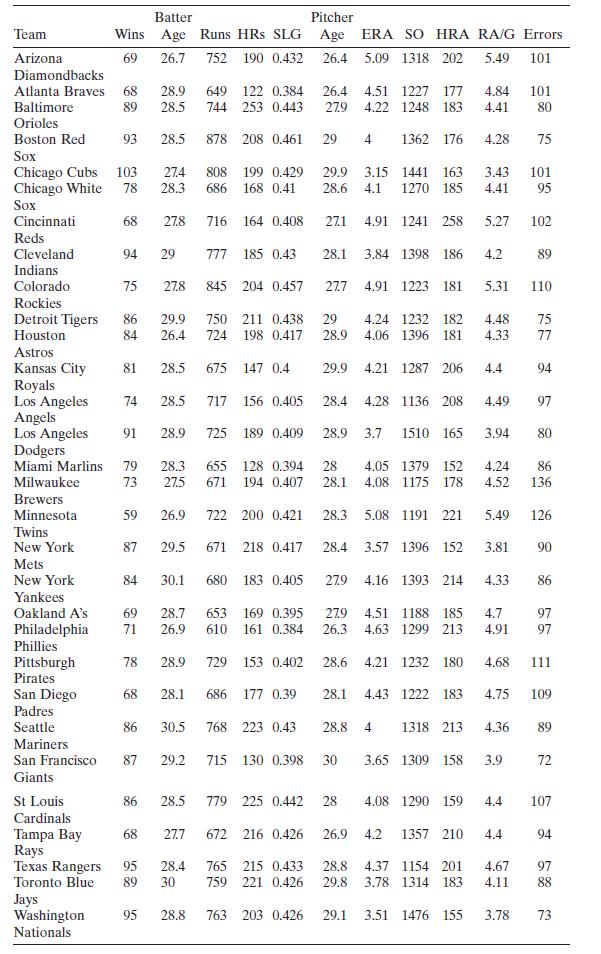
a. Test for significance of regression.
b. Is there an indication that all of the predictors are useful in explaining the number of wins?
c. What actions would you take to refine this model?
Transcribed Image Text:
Batter Pitcher Team Wins Age Runs HRS SLG Age ERA SO HRA RA/G Errors Arizona 69 26.7 752 190 0.432 26.4 5.09 1318 202 5.49 101 Diamondbacks Atlanta Braves 68 28.9 Baltimore 89 28.5 649 122 0.384 744 253 0.443 26.4 4.51 1227 177 279 4.22 1248 183 4.84 101 4.41 80 Orioles Boston Red 93 28.5 878 208 0.461 29 4 1362 176 4.28 75 Sox Chicago Cubs 103 27.4 808 Chicago White 78 28.3 686 199 0.429 168 0.41 29.9 3.15 1441 163 28.6 3.43 101 4.1 1270 185 4.41 95 Sox Cincinnati 68 27.8 716 164 0.408 27.1 4.91 1241 258 5.27 102 Reds Cleveland 94 +4 29 29 777 185 0.43 28.1 3.84 1398 186 4.2 89 Indians Colorado 75 15 27.8 845 204 0.457 27.7 4.91 1223 181 5.31 110 Rockies Detroit Tigers 86 Houston XX 29.9 84 26.4 750 211 0.438 724 198 0.417 29 28.9 4.24 1232 182 4.48 4.06 1396 181 4.33 275 75 77 Astros Kansas City 81 28.5 675 147 0.4 29.9 4.21 1287 206 4.4 94 Royals Los Angeles 74 28.5 717 156 0.405 28.4 4.28 1136 208 4.49 97 Angels Los Angeles 91 28.9 725 189 0.409 28.9 3.7 1510 165 3.94 80 Dodgers Miami Marlins Milwaukee 775 79 28.3 655 73 27.5 671 128 0.394 194 0.407 28 28.1 4.05 1379 152 4.24 86 4.08 1175 178 4.52 136 Brewers Minnesota 59 26.9 722 200 0.421 28.3 5.08 1191 221 5.49 126 Twins New York 97 87 29.5 671 218 0.417 28.4 3.57 1396 152 3.81 90 90 Mets New York 84 30.1 680 183 0.405 27.9 4.16 1393 214 4.33 Yankees Oakland A's 69 Philadelphia F 71 28.7 653 169 0.395 26.9 610 161 0.384 27.9 4.51 1188 185 4.7 26.3 4.63 1299 213 4.91 99 % 86 97 97 Phillies Pittsburgh 78 28.9 729 153 0.402 28.6 4.21 1232 180 4.68 111 Pirates San Diego 68 28.1 686 177 0.39 28.1 4.43 1222 183 4.75 109 Padres Seattle 86 30.5 768 223 0.43 28.8 4 1318 213 4.36 89 Mariners San Francisco 87 29.2 715 130 0.398 30 3.65 1309 158 3.9 72 Giants St Louis 86 28.5 779 225 0.442 28 4.08 1290 159 4.4 107 Cardinals Tampa Bay 68 27.7 672 216 0.426 26.9 4.2 1357 210 4.4 94 Rays Texas Rangers 95 28.4 Toronto Blue 89 30 765 215 0.433 759 221 0.426 28.8 4.37 1154 201 29.8 4.67 97 3.78 1314 183 4.11 88 Jays Washington 95 28.8 763 203 0.426 29.1 3.51 1476 155 3.78 73 Nationals