

Consider the National Football League data in Table B.1. a. Fit a multiple linear regression model relating
Question:
Consider the National Football League data in Table B.1.
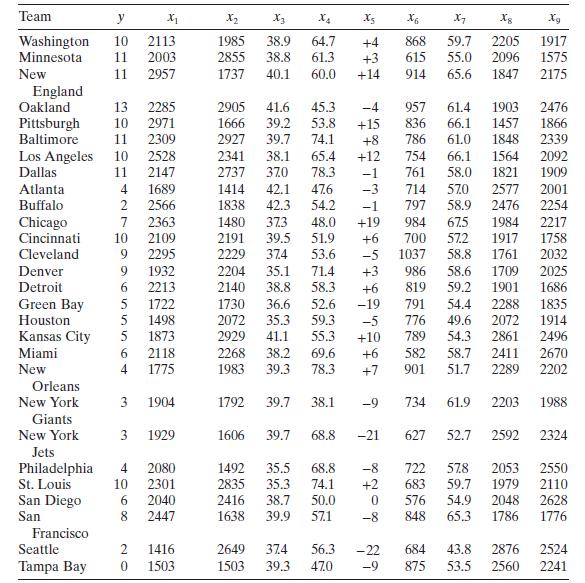
a. Fit a multiple linear regression model relating the number of games won to the team's passing yardage $\left(x_{2}\right)$, the percentage of rushing plays $\left(x_{7}\right)$, and the opponents' yards rushing $\left(x_{8}\right)$.
b. Construct the analysis-of-variance table and test for significance of regression.
c. Calculate $t$ statistics for testing the hypotheses $H_{0}: \beta_{2}=0, H_{0}: \beta_{7}=0$, and $H_{0}: \beta_{8}=0$. What conclusions can you draw about the roles the variables $x_{2}$, $x_{7}$, and $x_{8}$ play in the model?
d. Calculate $R^{2}$ and $R_{\text {Adj }}^{2}$ for this model.
e. Using the partial $F$ test, determine the contribution of $x_{7}$ to the model. How is this partial $F$ statistic related to the $t$ test for $\beta_{7}$ calculated in part $\mathrm{c}$ above?
Step by Step Answer:

This question has not been answered yet.
You can Ask your question!


Introduction To Linear Regression Analysis
ISBN: 9781119578727
6th Edition
Authors: Douglas C. Montgomery, Elizabeth A. Peck, G. Geoffrey Vining
