

Consider the simple linear regression model fit to the ozone data in Problem 2.13. Problem 2.13 Davidson
Question:
Consider the simple linear regression model fit to the ozone data in Problem 2.13.
Problem 2.13
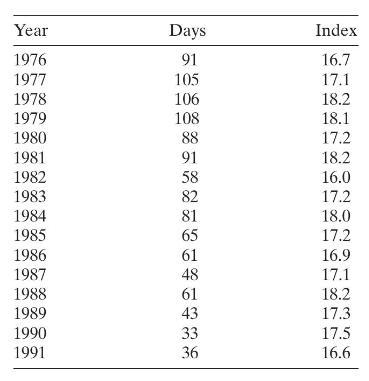
Davidson ("Update on Ozone Trends in California's South Coast Air Basin," Air and Waste, 43, 226, 1993) studied the ozone levels in the South Coast Air Basin of California for the years 1976-1991. He believes that the number of days the ozone levels exceeded $0.20 \mathrm{ppm}$ (the response) depends on the seasonal meteorological index, which is the seasonal average 850-millibar temperature (the regressor). The following table gives the data.
a. Construct a normal probability plot of the residuals. Does there seem to be any problem with the normality assumption?
b. Construct and interpret a plot of the residuals versus the predicted response.
c. Plot the residuals versus time order and comment on the plot.
Step by Step Answer:

This question has not been answered yet.
You can Ask your question!


Introduction To Linear Regression Analysis
ISBN: 9781119578727
6th Edition
Authors: Douglas C. Montgomery, Elizabeth A. Peck, G. Geoffrey Vining
