

Economic data for best-and-worst state economies for several states are shown below. Due to the large numbers,
Question:
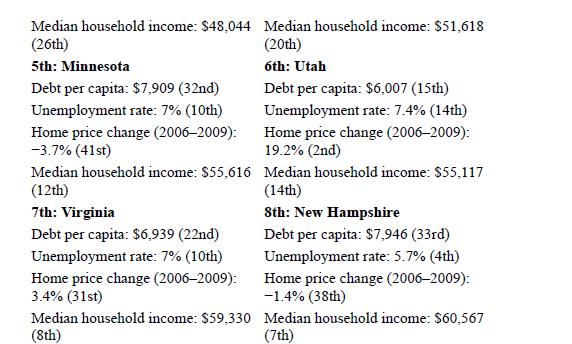
Economic data for best-and-worst state economies for several states are shown below. Due to the large numbers, which are difficult to compute by hand, enter the data into an Excel, Minitab, PASW, or your preferred spreadsheet. Obtain the correlation coefficient for per capita debt and household income.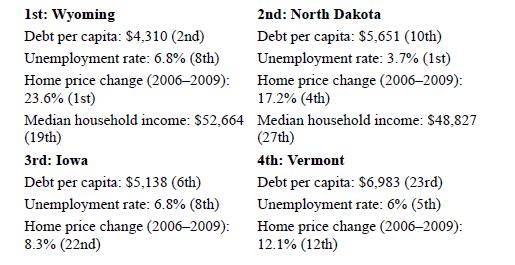
Extracted from http://www.theatlantic.com/business/archive/2010/10/the-best-and-worst-performingstate-economies-in-america/64307/
a. Do changes in income explain changes in debt levels? Does it appear that those in states with higher incomes incur more debt?
Obtain the regression model that addresses that issue. Compute and interpret the standard error of the estimate.
b. What is the correlation between these two variables? Interpret that correlation.
Step by Step Answer:


Introductory Regression Analysis With Computer Application For Business And Economics
ISBN: 9780415899338
1st Edition
Authors: Allen Webster
