

Set up a notional model of a research issue you choose and draw a chart similar to
Question:
Set up a notional model of a research issue you choose and draw a chart similar to Figure 4.7a, that has:
Data in Figure 4.7a
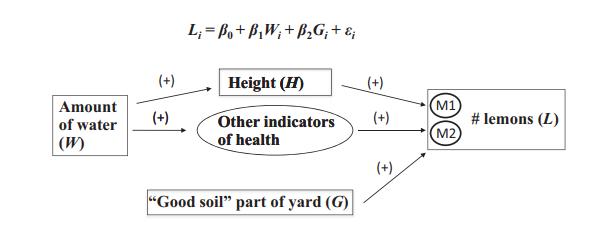
(a) At least one mediating factor that should not be controlled for (similar to the height of the lemon tree); and
(b) One variable that is not a mediating factor and should be controlled for (similar to the variable for the “good soil part of the yard”).
Step by Step Answer:

This question has not been answered yet.
You can Ask your question!
Related Book For 
Question Posted:
