

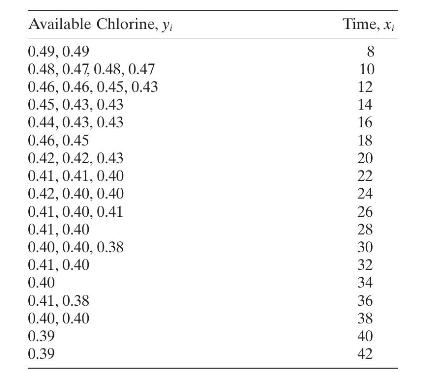
The data below represent the fraction of active chlorine in a chemical product as a function of
Question:
The data below represent the fraction of active chlorine in a chemical product as a function of time after manufacturing.
a. Construct a scatterplot of the data.
b. Fit the Mitcherlich law (see Problem 12.10) to these data. Discuss how you obtained the starting values.
Data From Problen
c. Test for significance of regression.
d. Find approximate \(95 \%\) confidence intervals on the parameters \(\theta_{1}, \theta_{2}\), and \(\theta_{3}\). Is there evidence to support the claim that all three parameters are different from zero?
e. Analyze the residuals and comment on model adequacy.
Fantastic news! We've Found the answer you've been seeking!
Step by Step Answer:

Answered By
Bhartendu Goyal
Professional, Experienced, and Expert tutor who will provide speedy and to-the-point solutions. I have been teaching students for 5 years now in different subjects and it's truly been one of the most rewarding experiences of my life. I have also done one-to-one tutoring with 100+ students and help them achieve great subject knowledge. I have expertise in computer subjects like C++, C, Java, and Python programming and other computer Science related fields. Many of my student's parents message me that your lessons improved their children's grades and this is the best only thing you want as a tea...
2+ Reviews
10+ Question Solved
Related Book For 

Introduction To Linear Regression Analysis
ISBN: 9781119578727
6th Edition
Authors: Douglas C. Montgomery, Elizabeth A. Peck, G. Geoffrey Vining
Question Posted:
