

Consider the data given in Table 1.8 (Example 1.3) again. Draw the histograms for the following problem
Question:
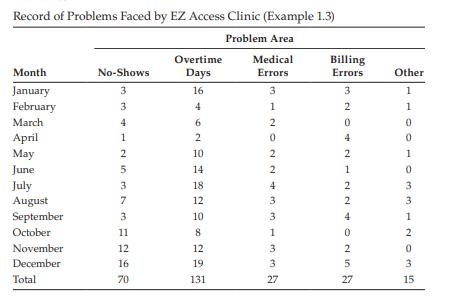
Consider the data given in Table 1.8 (Example 1.3) again. Draw the histograms for the following problem areas:
a. No-shows
b. Overtime days
c. Medical errors What can you conclude based on the above histograms?
Table 1.8:
Step by Step Answer:

This question has not been answered yet.
You can Ask your question!
Related Book For 

Service Systems Engineering And Management
ISBN: 978-0367781323
1st Edition
Authors: A. Ravi Ravindran ,Paul M. Griffin ,Vittaldas V. Prabhu
Question Posted:
