Obtain the daily unadjusted closing prices of INTC, GLD, and the Nasdaq Composite for the year 2017
Question:
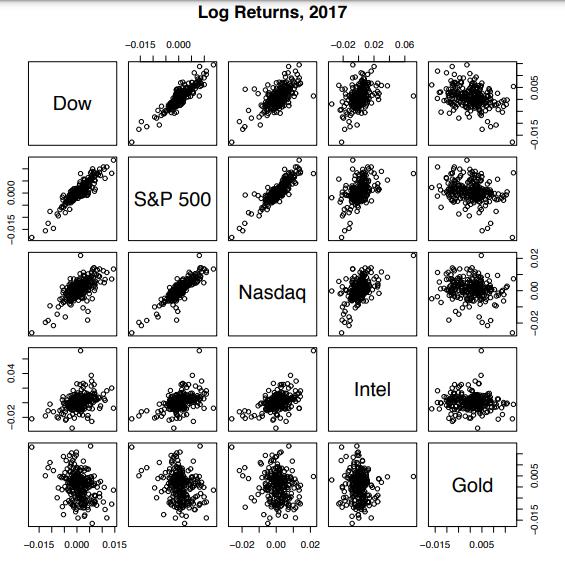
Obtain the daily unadjusted closing prices of INTC, GLD, and the Nasdaq Composite for the year 2017 and compute the log returns. These data were shown in the displays in Figure 1.22.
(a) Produce a scatterplot of the returns of INTC and versus the returns of the Nasdaq Composite, and another scatterplot of the returns of GLD and versus the returns of the Nasdaq Composite, for the year 2017.
Our interest is in the relationships of the returns in the tails of the bivariate distributions.
On each scatterplot draw a vertical line at the \(p=0.05\) quantile of the sample of returns on the horizontal axis and a horizontal line at the \(p=0.05\) quantile of the sample of returns on the vertical axis.
(b) Compute the sample tail dependency at \(p=0.05\) for returns of INTC and the Nasdaq Composite, and for returns of GLD and the Nasdaq Composite for the year 2017.
Comment on the results.
Figure 1.22:
Step by Step Answer:

This question has not been answered yet.
You can Ask your question!