

Figure 3.43 shows the numbers of U.S. adoptions from other countries in the years 2004 and 2015.
Question:
Figure 3.43 shows the numbers of U.S. adoptions from other countries in the years 2004 and 2015. What is wrong with this graph? Draw a graph that depicts the data in a fair and objective way.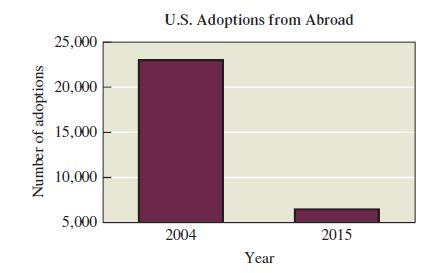
Fantastic news! We've Found the answer you've been seeking!
Step by Step Answer:
The graph is extremely misleading The vertical axis does not start at zero making the difference in ...View the full answer

Answered By
Abdullah Waseem
Hello! I’m Abdullah Waseem! I have completed my graduation in Accounting & Finance from the University of Central Punjab, Lahore. I specialize in Finance, Accounting, Business, Management, Marketing, and Auditing. I have many experiences working as a content developer/writer. I have completed many projects for my clients and I have completed many assignments/expert questions for students globally. I always look for opportunities and for better growth. I’m sure that I will work efficiently with your online website. I have been online tutoring since I was doing my degree. I've helped so many students achieve their academic goals year after year. I always feel good while tutoring the students and providing help to complete their requirements. I can help you in completing the assignments and different projects. I am looking forward to working for you and being able to meet your work requirements and hope to work with you soon as well.
0 Reviews
10+ Question Solved
Related Book For 

Statistical Reasoning For Everyday Life
ISBN: 978-0134494043
5th Edition
Authors: Jeff Bennett, William Briggs, Mario Triola
Question Posted:
