

Refer to the data given in Exercise 17, and construct a pie chart. Compare the pie chart
Question:
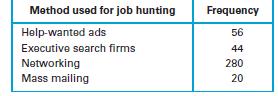
Refer to the data given in Exercise 17, and construct a pie chart. Compare the pie chart to the Pareto chart. Can you determine which graph is more effective in showing the relative usefulness of the job–hunting methods?
Exercise 17
A survey was conducted to determine how employees found their jobs. The table below lists the successful methods identified by 400 randomly selected employees. The data are based on results from the National Center for Career Strategies. Construct a Pareto chart that displays the given data. Based on these results, what appears to be the best method for someone seeking employment?
Fantastic news! We've Found the answer you've been seeking!
Step by Step Answer:
To construct a pie chart from the given data you can use the following code Import matplotlibpyplot ...View the full answer

Answered By
Joash Mokaya
I am an experienced tutor with more than 7 years of experience. I have helped thousands of students pursue their academic goals. My primary objective as a tutor is to ensure that students have an easy time handling their academic tasks.
0 Reviews
10+ Question Solved
Related Book For 

Statistical Reasoning For Everyday Life
ISBN: 978-0134494043
5th Edition
Authors: Jeff Bennett, William Briggs, Mario Triola
Question Posted:
