

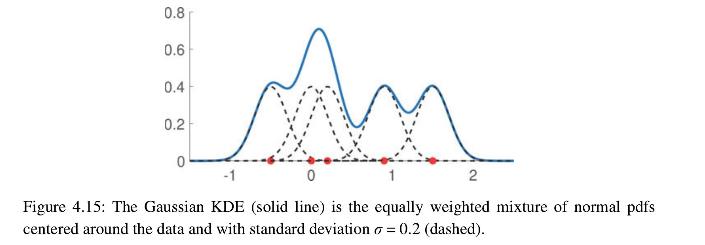
Figure 4. 15 shows a Gaussian KDE with bandwidth (sigma=0.2) on the points (-0.5,0,0.2,0.9), and 1. 5.
Question:
Figure 4.
15 shows a Gaussian KDE with bandwidth \(\sigma=0.2\) on the points \(-0.5,0,0.2,0.9\), and 1.
5. Reproduce the plot in Python. Using the same bandwidth, plot also the KDE for the same data, but now with \(\phi(z)=1 / 2, z \in[-1,1]\).
Fantastic news! We've Found the answer you've been seeking!
Step by Step Answer:
The following Python c...View the full answer

Answered By
Pushpinder Singh
Currently, I am PhD scholar with Indian Statistical problem, working in applied statistics and real life data problems. I have done several projects in Statistics especially Time Series data analysis, Regression Techniques.
I am Master in Statistics from Indian Institute of Technology, Kanpur.
I have been teaching students for various University entrance exams and passing grades in Graduation and Post-Graduation.I have expertise in solving problems in Statistics for more than 2 years now.I am a subject expert in Statistics with Assignmentpedia.com.
3+ Reviews
10+ Question Solved
Related Book For 

Data Science And Machine Learning Mathematical And Statistical Methods
ISBN: 9781118710852
1st Edition
Authors: Dirk P. Kroese, Thomas Taimre, Radislav Vaisman, Zdravko Botev
Question Posted:
