

Goodcarbadcar is an online portal (www.goodcarbadcar.net) that reports automotive industry data. The table shows the number of
Question:
Goodcarbadcar is an online portal (www.goodcarbadcar.net) that reports automotive industry data. The table shows the number of cars sold in the United States in 2019 and 2020. The top 34 brands are listed. Sales data are often reported in this way to compare current sales to last year’s sales.
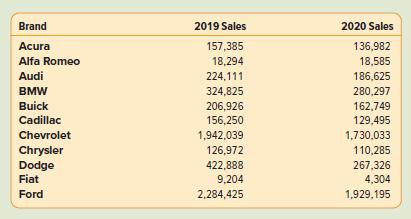
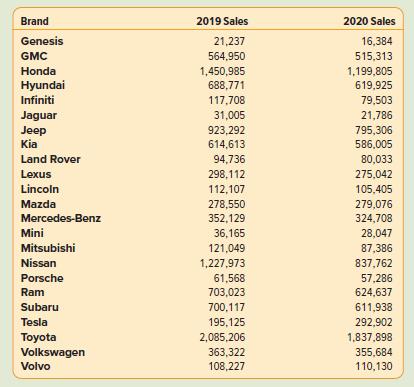
a. Using computer software, compare 2019 sales to 2020 sales for each brand by computing the difference. Make a list of the brands that increased sales in 2020 compared to 2019; make a list of brands that decreased sales.
b. Using computer software, compare 2019 sales to 2020 sales for each brand by computing the percentage change in sales. Make a list of the brands in order of increasing percentage changes. Which brands are in the top five in percentage change? Which brands are in the bottom five in percentage change?
c. Using computer software, first sort the data using the 2020 year-to-date sales. Then, design a bar graph to illustrate the 2019 and 2020 year-to-date sales for the top 10 brands. Also, design a bar graph to illustrate the percentage change for the top 10 brands. Compare these two graphs in a brief written report.
Step by Step Answer:
a From differences it is clear that the sales of almost every brand decreased from 2019 to 2020 The ...View the full answer


Statistical Techniques In Business And Economics
ISBN: 9781265779696
19th Edition
Authors: Douglas Lind, William Marchal, Samuel Wathen
