

Perform the universal S-T kriging as that of Example 9.2 but using the daily maximum temperature of
Question:
Perform the universal S-T kriging as that of Example 9.2 but using the daily maximum temperature of July 1993.
Example 9.2:
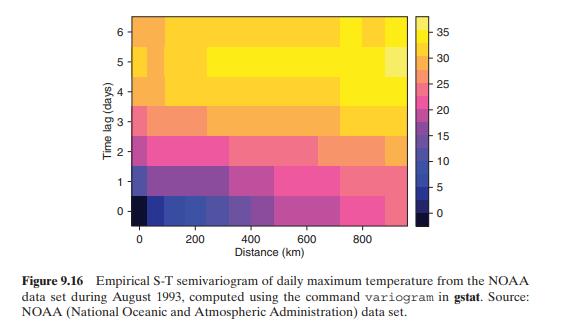
Here we only employ that data of August 1993, which are available from the package STRbook. The data contains 10, 168 observations and 12 variables. The variables include longitude, latitude, year, month, day, location ID, and maximum daily temperature, among others. There are 328 locations and each location has 31 observations. Our goal here is to use the August 1993 data to demonstrate S-T universal kriging using the semivariogram with the package gstat. Following Wikle et al. (2019), we also use the package RColorBrewer to color some of the surfaces in plotting. The empirical semivariogram of the August maximum temperature is given in Figure 9.16, which is produced by the command variogram with a fixed latitude effect (i.e. using latitude as an explanatory variable), spatial bin of 80 km, points less than 1000 km apart, and time lags from 0 to 6 days. Details of the R commands are given below.
Step by Step Answer:


Statistical Learning For Big Dependent Data
ISBN: 9781119417385
1st Edition
Authors: Daniel Peña, Ruey S. Tsay
