

Perform the analysis of Example 9.4 but on the daily maximum temperature of July 1993. Example 9.4:
Question:
Perform the analysis of Example 9.4 but on the daily maximum temperature of July 1993.
Example 9.4:
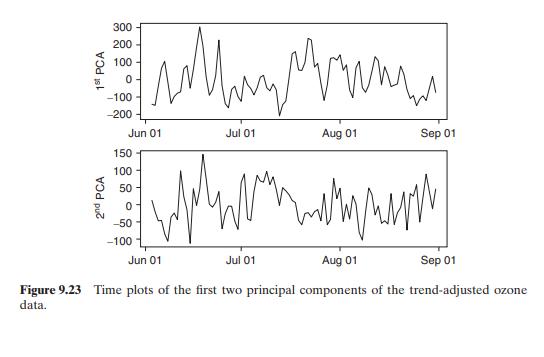
Consider again the ozone measurements of Midwestern United States. In this particular instance, we have T = 89 and m = 153 so that the sample covariance matrix is singular and the conventional PCA is not useful. As in Example 9.2, we focus on the trend-adjusted data. Figure 9.22 shows the first two eigenfunctions of the trend-adjusted ozone data. From the plots, it is not surprising to see that the first eigenfunction has large weights along the west shoreline of Lake Michigan in northern Illinois and southern Wisconsin. On the other hand, the second eigenfunction shows certain geographical effect as it shows heavier weights on northern states (Wisconsin, Michigan, Northern Illinois) and lighter weights on southern states (Ohio and Kentucky). Figure 9.23 shows the time plots of the first two principal components. These plots indicates that the components appear to be temporally stationary
Step by Step Answer:


Statistical Learning For Big Dependent Data
ISBN: 9781119417385
1st Edition
Authors: Daniel Peña, Ruey S. Tsay
