

The data set in Table 2.9 consists of the profits/losses (in millions of dollars) for a random
Question:
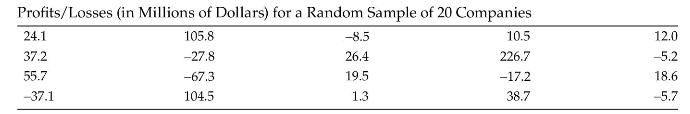
The data set in Table 2.9 consists of the profits/losses (in millions of dollars) for a random sample of 20 companies.
a. Draw a histogram of the company profits/losses for this sample of companies using the default settings in Minitab.
b. Using Minitab, draw a histogram with 20 bins of the company profits/losses for this sample of companies.
c. Using Minitab, draw a histogram with 10 bins of the company profits/losses for this sample of companies.
d. Which of these three histograms is more revealing as to the distribution of the company profits/losses?
Table 2.9
Step by Step Answer:

This question has not been answered yet.
You can Ask your question!
Related Book For 

Question Posted:
