

Using Minitab and the profit/loss data provided in Table 2.9, create a boxplot. Find the values for
Question:
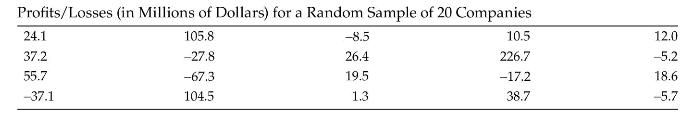
Using Minitab and the profit/loss data provided in Table 2.9, create a boxplot. Find the values for \(Q_{1}, Q_{2}\), and \(Q_{3}\), the upper and lower limits, the upper and lower whiskers, and identify any outliers.
Table 2.9
Fantastic news! We've Found the answer you've been seeking!
Step by Step Answer:

Answered By
Maruhti ramakrishna lanka
I have done my engineering in electrical and electronics field. During my college days, i used to conduct workshops on micro-controller IDEs, teach juniors on circuits, control systems and embedded systems. i was tutoring online for one year, which later i dropped down as i was preparing for job interviews. I got into aerospace field and been working here from 10months. i wanted to tutor online as sharing what i know, gives me happiness.
0 Reviews
10+ Question Solved
Related Book For 
Question Posted:
