

Using the following time series data of U.S. new car sales ($ millions), respond to the following
Question:
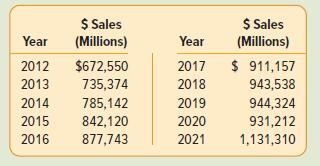
Using the following time series data of U.S. new car sales ($ millions), respond to the following items. (The data are sourced from https://www.census.gov/retail/index.html#mrts. Find “Monthly Retail Trade Report,” then select “Time Series/Trend Charts” to find the data for U.S. new car sales.)
a. Graph the data.
b. Based on the graph, describe the time series pattern.
c. For this time series, why is forecasting with a trend model appropriate?
d. Evaluate a trend forecasting model using simple linear regression. What are the MAD and MAPE?
e. What is the predicted annual change in industry sales?
f. Predict sales for the next 3 years.
g. In your judgment, are the forecasts “good”? What disclaimer would you include with your forecast?
Step by Step Answer:
a b The graph shows a upward positive trend in new car sales dollars c Forecasting with a trend mode...View the full answer


Statistical Techniques In Business And Economics
ISBN: 9781265779696
19th Edition
Authors: Douglas Lind, William Marchal, Samuel Wathen
