

The following data report total, monthly U.S. gasoline sales in millions of dollars from January 2020 to
Question:
The following data report total, monthly U.S. gasoline sales in millions of dollars from January 2020 to December 2021. (To find the data, go to the site https://www.census.gov/retail/index.html#mrts, find “Monthly Retail Trade Report,” then select “Time Series/Trend Charts.”)
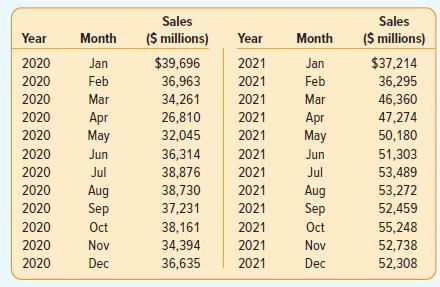
a. Graph the data.
b. Based on the graph, describe the time series pattern.
c. For this time series, why is forecasting with a seasonally adjusted trend model appropriate?
d. Evaluate a seasonally adjusted trend forecasting model. What are the MAD and MAPE?
e. What are the monthly indexes?
f. Forecast sales for January, February, March, and April of 2022.
Fantastic news! We've Found the answer you've been seeking!
Step by Step Answer:
a b The monthly time series shows two patterns positive tre...View the full answer

Answered By
Mr. VISHAL
I'm pursuing msc. Chemistry (organic specialisation). I have deep knowledge of chemistry and i can explain the concepts in a very simple way. I also like to give lectures on specific topics.
My linkedin profile is:
www.linkedin.com/in/vishal-chnaliya-66a85514b
0 Reviews
10+ Question Solved
Related Book For 

Statistical Techniques In Business And Economics
ISBN: 9781265779696
19th Edition
Authors: Douglas Lind, William Marchal, Samuel Wathen
Question Posted:
