

Consider the following chart. a. What is this chart called? b. How many observations are in the
Question:
Consider the following chart.
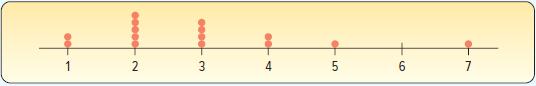
a. What is this chart called?
b. How many observations are in the study?
c. What are the maximum and the minimum values?
d. Around what values do the observations tend to cluster?
Fantastic news! We've Found the answer you've been seeking!
Step by Step Answer:

Related Book For 

Statistical Techniques In Business And Economics
ISBN: 9781260239478
18th Edition
Authors: Douglas Lind, William Marchal, Samuel Wathen
Question Posted:
