

Following are the weights (in grams) of a sample of M&Ms Plain candies, classified according to color.
Question:
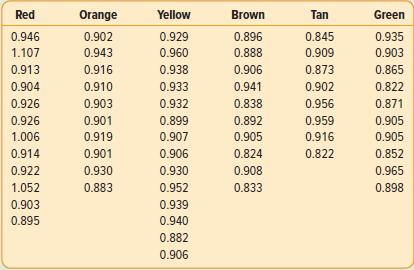
Following are the weights (in grams) of a sample of M&M’s Plain candies, classified according to color. Use a statistical software system to determine whether there is a difference in the mean weights of candies of different colors.
a. What are the null and alternate hypotheses?
b. What is the test statistic?
c. What is the p-value?
d. Using a .05 significance level, what is your decision regarding the null hypothesis?
e. Interpret the result.
Fantastic news! We've Found the answer you've been seeking!
Step by Step Answer:
a H o R O Y B T G H 1 The treatment means are not equal Reject H o if F 23...View the full answer

Answered By
OTIENO OBADO
I have a vast experience in teaching, mentoring and tutoring. I handle student concerns diligently and my academic background is undeniably aesthetic
3+ Reviews
10+ Question Solved
Related Book For 

Statistical Techniques In Business And Economics
ISBN: 9781260239478
18th Edition
Authors: Douglas Lind, William Marchal, Samuel Wathen
Question Posted:
