

Refer to the Baseball 2018 data, which report information on the 30 Major League Baseball teams for
Question:
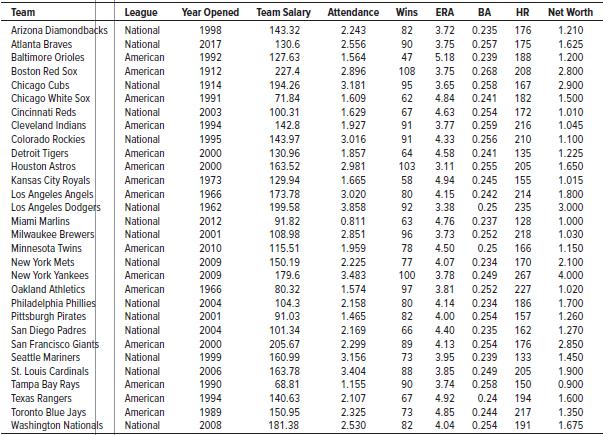
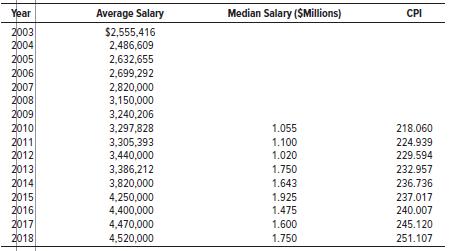
Refer to the Baseball 2018 data, which report information on the 30 Major League Baseball teams for the 2018 season. Set up a variable that divides the teams into two groups, those that had a winning season and those that did not. There are 162 games in the season, so define a winning season as having won 81 or more games. Next, find the median team salary and divide the teams into two salary groups. Let the 15 teams with the largest salaries be in one group and the 15 teams with the smallest salaries be in the other. At the .05 significance level, is there a relationship between salaries and winning?
Data From Baseball 2018:
Fantastic news! We've Found the answer you've been seeking!
Step by Step Answer:
H o Salary and winning are not related H 1 Salary and winning ar...View the full answer

Answered By
Shivani Gupta
I have done mtech from very reputed college .i am very passionate about teaching.i have more than 2 years of experience in teaching physics and prepared them for competitive exams like IIT-JEE and neet exams. I make physics easy to students as they think physics is difficult for them.
0 Reviews
10+ Question Solved
Related Book For 

Statistical Techniques In Business And Economics
ISBN: 9781260239478
18th Edition
Authors: Douglas Lind, William Marchal, Samuel Wathen
Question Posted:
